
Conventional and Advanced Post-treatment Magnetic Resonance Imaging of Primary and Metastatic Brain Tumours: A Pictorial Essay
PICTORIAL ESSAY
Hong Kong J Radiol 2023 Sep;26(3):217-32 | Epub 15 Sep 2023
Conventional and Advanced Post-treatment Magnetic Resonance Imaging of Primary and Metastatic Brain Tumours: A Pictorial Essay
JCY Lau1, AYT Lai1, KYK Tang1, CY Chu1, PY Wu2, WK Kan1
1 Department of Radiology, Pamela Youde Nethersole Eastern Hospital, Hong Kong SAR, China
2 Department of Clinical Oncology, Pamela Youde Nethersole Eastern Hospital, Hong Kong SAR, China
Correspondence: Dr JCY Lau, Department of Radiology, Pamela Youde Nethersole Eastern Hospital, Hong Kong SAR, China. Email: lcy486@ha.org.hk
Submitted: 5 Jan 2022; Accepted: 17 May 2022.
Contributors: JCYL and AYTL designed the study. JCYL, AYTL and PYW acquired the data. JCYL and AYTL analysed the data. JCYL
drafted the manuscript. All authors critically revised the manuscript for important intellectual content. All authors had full access to the data,
contributed to the study, approved the final version for publication, and take responsibility for its accuracy and integrity.
Conflicts of Interest: All authors have disclosed no conflicts of interest.
Funding/Support: This study received no specific grant from any funding agency in the public, commercial, or not-for-profit sectors.
Data Availability: All data generated or analysed during the present study are available from the corresponding author on reasonable request.
Ethics Approval: The study was approved by the Hong Kong East Cluster Research Ethics Committee of Hospital Authority, Hong Kong (Ref
No.: HKECREC-2022-001). A waiver for written informed consent of patients was granted by the Committee as this manuscript is for pictorial
review only and does not involve patient treatment/procedures.
INTRODUCTION
Both primary and secondary brain neoplasms are
commonly encountered in neuroimaging. Glioblastoma
is the most common primary malignant brain tumour
in adults.[1] Mortality remains high despite development
of different treatment options with combinations of
surgery, radiotherapy, and chemotherapy. The 2-year
and 5-year survival rates after diagnosis of glioblastoma
are reported to be approximately 26.5%[2] and 5% to 10%,[3] respectively. Evaluation of treatment response
and detection of treatment-related complications are
crucial in patient management and rely heavily on
neuroimaging.
Brain tumour treatment response criteria have been
established to evaluate treatment progression or
regression of gliomas. Currently, the most widely used
set of criteria is the Response Assessment in Neuro-Oncology (RANO) criteria.[1] First proposed in 2010,
the RANO criteria assess measurable disease, non-measurable disease, use of corticosteroids, and clinical
status[2] for assessment of treatment response, which are
discussed in this article.
There are significant overlapping features with
conventional magnetic resonance imaging (MRI)
techniques among treatment response and disease
progression and/or treatment-related complications.
Advanced MRI techniques, including MR spectroscopy
(MRS) and perfusion, are useful adjuncts to facilitate
interpretation of post-treatment brain tumour images,
especially in identifying pseudoprogression or
pseudoresponse.[4] [5]
This pictorial essay illustrates the broad spectrum
of treatment-related complications, the different
treatment responses of brain tumours as classified by
the RANO criteria, and utilisation of advanced MRI
techniques in identifying treatment-related changes, e.g.,
pseudoprogression or pseudoresponse.
TREATMENT RESPONSE ASSESSMENT USING THE RESPONSE ASSESSMENT IN NEURO-ONCOLOGY CRITERIA
Definitions
Measurable disease is defined as bi-dimensionally (two
perpendicular diameters) contrast-enhancing lesions
of at least 10 mm, while non-measurable disease is
defined as either unidimensionally measurable lesions,
masses with unclear margins, or lesions with maximal
perpendicular diameters of <10 mm.[4] Cysts or the
surgical cavity should be considered non-measurable
unless there is a nodular component measuring at least
10 mm in diameter.[4] Lesions with T2/fluid-attenuation
inversion recovery (FLAIR) hyperintense signals are
considered non-measurable.[1]
Multiple Lesions
A minimum of two and a maximum of five target
lesions may be counted to reflect tumour burden. The
sum of the products of the perpendicular diameters are
used for determining treatment response. Although
the largest lesions are commonly selected, emphasis
should be made on lesions with reproducible
measurements.[4]
Categories of treatment response, which are from
Leao et al1 and Wen et al,[4] are summarised as follows.
Complete response
It requires all of the following: complete disappearance of
all enhancing measurable and non-measurable diseases
sustained for at least 4 weeks; no new lesions; and stable
or improved non-enhancing (T2/FLAIR hyperintensity)
lesions. Patients must be off corticosteroids (or on
physiological replacement doses only) and should be in
a stable or clinically improved status (Figure 1).[4]
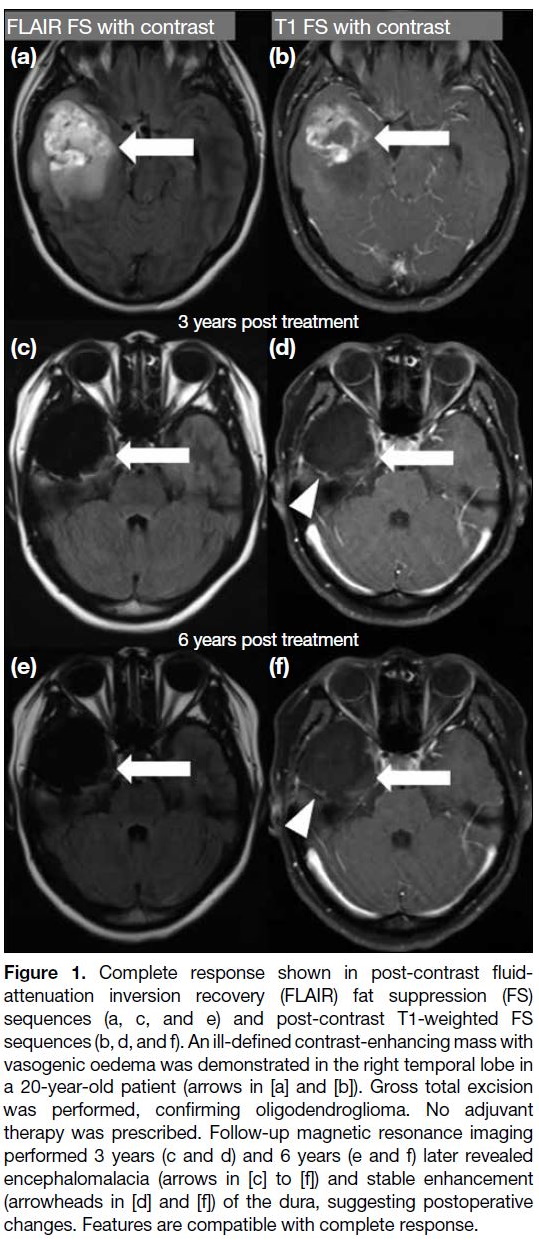
Figure 1. Complete response shown in post-contrast fluid-attenuation
inversion recovery (FLAIR) fat suppression (FS)
sequences (a, c, and e) and post-contrast T1-weighted FS
sequences (b, d, and f). An ill-defined contrast-enhancing mass with
vasogenic oedema was demonstrated in the right temporal lobe in
a 20-year-old patient (arrows in [a] and [b]). Gross total excision
was performed, confirming oligodendroglioma. No adjuvant
therapy was prescribed. Follow-up magnetic resonance imaging
performed 3 years (c and d) and 6 years (e and f) later revealed
encephalomalacia (arrows in [c] to [f]) and stable enhancement
(arrowheads in [d] and [f]) of the dura, suggesting postoperative
changes. Features are compatible with complete response.
Partial response
It requires all of the following: ≥50% decrease in the
sum of products of perpendicular diameters of all
measurable enhancing lesions compared with baseline
scan sustained for at least 4 weeks; no progression of
non-measurable disease; no new lesions; stable or
improved non-enhancing (T2/FLAIR hyperintensity)
lesions on the same or a lower dose of corticosteroids
compared with baseline scan; and the patient being on
a corticosteroid that is not greater than the dose at time
of the baseline scan and should be in stable or clinically
improved status (Figure 2).[4]
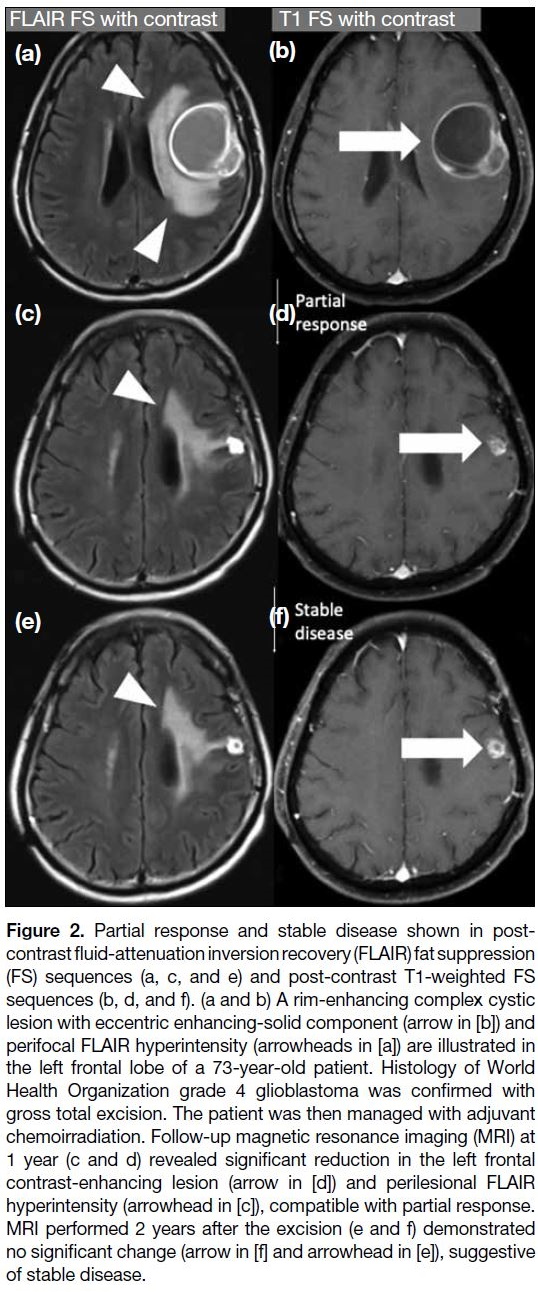
Figure 2. Partial response and stable disease shown in
post-contrast fluid-attenuation inversion recovery (FLAIR) fat
suppression (FS) sequences (a, c, and e) and post-contrast T1-weighted FS sequences (b, d, and f). (a and b) A rim-enhancing
complex cystic lesion with eccentric enhancing-solid component (arrow in [b]) and
perifocal FLAIR hyperintensity (arrowheads in [a]) are illustrated in
the left frontal lobe of a 73-year-old patient. Histology of World
Health Organization grade 4 glioblastoma was confirmed with
gross total excision. The patient was then managed with adjuvant
chemoirradiation. Follow-up magnetic resonance imaging (MRI) at
1 year (c and d) revealed significant reduction in the left frontal
contrast-enhancing lesion (arrow in [d]) and perilesional FLAIR
hyperintensity (arrowhead in [c]), compatible with partial response.
MRI performed 2 years after the excision (e and f) demonstrated
no significant change (arrow in [f] and arrowhead in [e]), suggestive
of stable disease.
Stable disease
It requires all of the following: not qualified for complete response, partial response or progression; stable non-enhancing
(T2/FLAIR hyperintensity) lesion; the patient
being on the same or lower dose of corticosteroids
compared with baseline scan and should be in clinically
stable status (Figures 2 and 3).[1] [4]
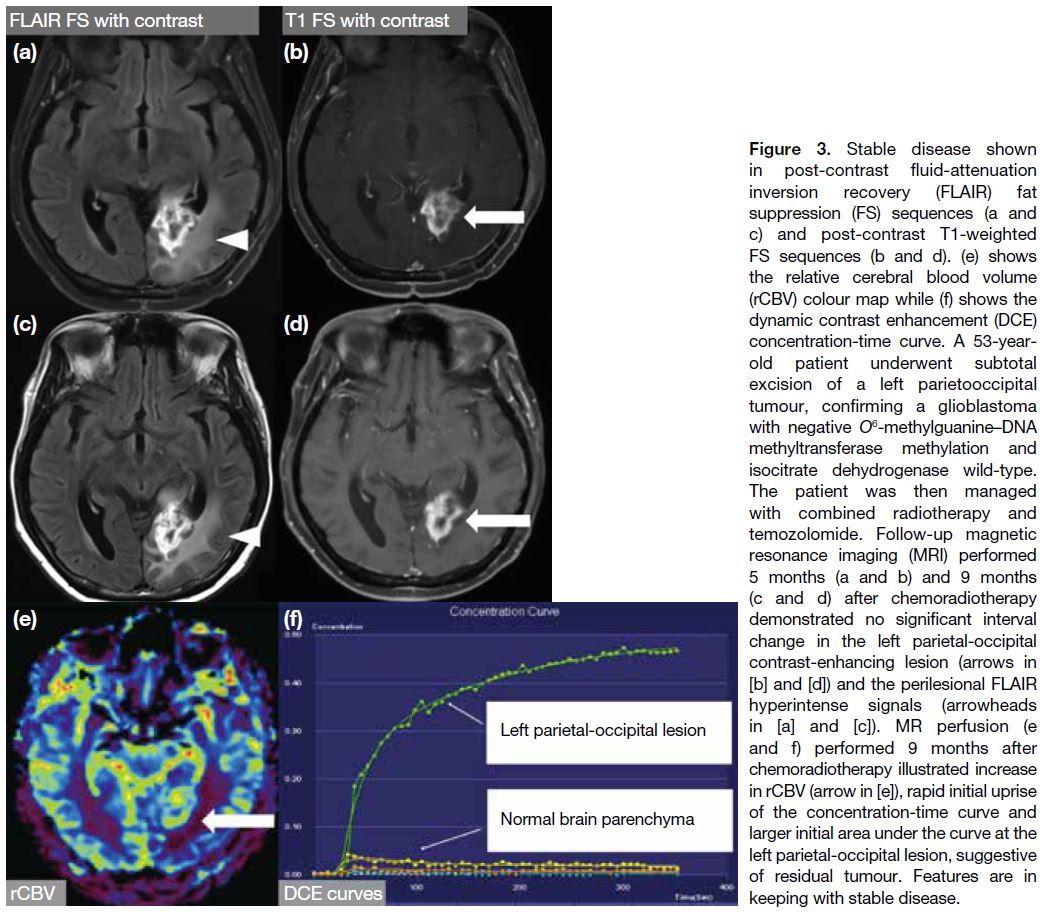
Figure 3. Stable disease shown
in post-contrast fluid-attenuation
inversion recovery (FLAIR) fat
suppression (FS) sequences (a and
c) and post-contrast T1-weighted
FS sequences (b and d). (e) shows
the relative cerebral blood volume
(rCBV) colour map while (f) shows the
dynamic contrast enhancement (DCE)
concentration-time curve. A 53-year-old
patient underwent subtotal
excision of a left parietooccipital
tumour, confirming a glioblastoma
with negative O6-methylguanine—DNA methyltransferase methylation
and isocitrate dehydrogenase wild-type.
The patient was then managed
with combined radiotherapy and
temozolomide. Follow-up magnetic
resonance imaging (MRI) performed
5 months (a and b) and 9 months
(c and d) after chemoradiotherapy
demonstrated no significant interval
change in the left parietal-occipital
contrast-enhancing lesion (arrows in [b] and [d]) and
the perilesional FLAIR hyperintense
signals (arrowheads in [a] and [c]).
MR perfusion (e and f) performed
9 months after chemoradiotherapy
illustrated increase in rCBV (arrow
in [e]), rapid initial uprise of the
concentration-time curve and larger
initial area under the curve at the left
parietal-occipital lesion, suggestive
of residual tumour. Features are in
keeping with stable disease.
Disease progression
It is defined by any of the following: ≥25% increase
in sum of the products of perpendicular diameters of
enhancing lesions compared with the smallest tumour
measurement obtained either at baseline scan (if no decrease) or best response; on stable or increasing doses
of corticosteroids; significant increase in non-enhancing
T2/FLAIR hyperintensity lesion on stable or increasing
doses of corticosteroids compared with baseline scan
or best response after initiation of therapy, not caused
by comorbid events; any new lesion; clear clinical
deterioration not attributable to other causes apart from
the tumour or changes in corticosteroid dose; failure to
return for evaluation as a result of death or deteriorating
condition; or clear progression of non-measurable
disease (Figures 4, 5, and 6).[1] [4]
Figure 4. Disease progression shown
in post-contrast fluid-attenuation
inversion recovery (FLAIR) fat
suppression (FS) sequences (a, c, f, and h), post-contrast T1-weighted FS sequences (b, d, g, and i), and T1-weighted sequence
(e). A 72-year-old patient presented
with a heterogeneously enhancing
left frontal mass (arrow in [b]) with
perilesional FLAIR hyperintense
signals (arrowheads in [a]). The
patient underwent gross total
excision of the tumour with pathology
suggesting glioblastoma (GB). Early
postoperative magnetic resonance
imaging (MRI) [c, d, and e] showed
significant reduction in size of the
left frontal tumour and FLAIR signals
(arrowheads in [c]) with presence
of T1-weighted hyperintensity (thin
arrows in [d] and [e]), suggesting
subacute blood products.
Radiotherapy was prescribed and
follow-up MRI performed 3 months
later (f and g) revealed increased
contrast enhancement (arrow
in [g]) and FLAIR hyperintensity
(arrowheads in [f]) in the left frontal-parietal
region. Combined with the
findings in Figure 5, features are most
compatible with disease progression,
which was confirmed in subsequent
follow-up MRI (h and i), showing
increase in size of the enhancing
mass (arrow in [i]) and perilesional
FLAIR hyperintensity (arrowheads in [h]).

Figure 5. Disease progression in
the same patient as in Figure 4 with
magnetic resonance (MR) perfusion
and MR spectroscopy (MRS)
performed 3 months after excision of
the left frontal glioblastoma. (a) shows
relative cerebral blood volume (rCBV)
map, (b) shows MRS, (c) shows
dynamic contrast enhancement
(DCE) regions of interest [ROIs],
and (d) shows DCE concentration-time
curves. The left frontal lesion
demonstrated elevated rCBV (arrow
in [a]), an elevated choline (Cho)
peak with reversed Cho-to–N-acetylaspartate
(NAA) ratio (b), a
rapid rise in initial DCE enhancement,
and a larger initial area under the
curve as compared to the normal
brain parenchyma (d). Together with
the findings in Figure 4, features are
in keeping with disease progression.
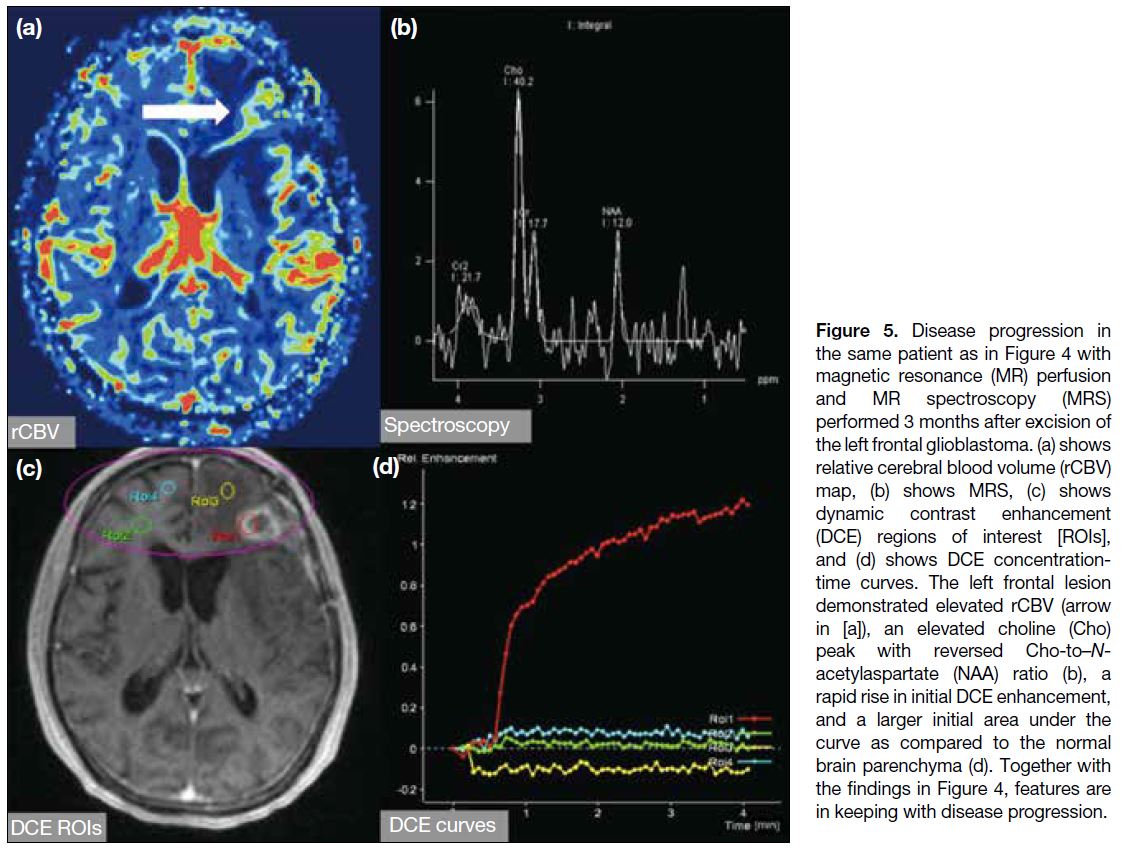
Figure 6. Disease progression. A 79-year-old patient with right cerebellar glioblastoma underwent gross total excision and managed with
adjuvant radical radiotherapy (a to c). The images show a contrast enhancing lesion at right cerebellum on post-contrast T1-weighted fat
saturation (FS) sequences at preoperation (arrow in [a]), 1 month postoperation (arrow in [b]), and after completing chemoradiotherapy (arrow
in [c]); (d) shows relative cerebral blood volume (rCBV) colour map while (f) shows magnetic resonance spectroscopy. After completing
chemoradiotherapy, the enlarging right cerebellar mass (arrow in [c]) showed elevated cerebral perfusion (arrow in [d]) and an elevated
choline (Cho) peak with a reversed Cho-to–N-acetylaspartate (NAA) ratio of >2 (f). Dynamic contrast enhancement (DCE) regions of interest
(ROIs) were demonstrated in (e) [purple circle]. Steep upslope of the concentration-time curves and larger initial areas under the curve were
illustrated as compared to the normal left cerebellar hemisphere (g). This was histologically proven to be tumour recurrence and disease
progression.

PSEUDOPROGRESSION
The Stupp protocol, consisting of maximal safe excision
and adjuvant radiotherapy with concurrent and adjuvant
temozolomide, is considered the standard of care for
glioblastoma.[2]
New or progressive contrast enhancement can develop
as a result of irradiation or treatment, in addition to
true tumour progression. The RANO criteria define
phenomenon that eventually subsides without alteration
of management as pseudoprogression (Figures 7 and 8),[1] [4]
with reported incidence of up to 21% to 36%.[1] [6] It is more
commonly encountered in glioblastoma with positive
methylated O6-methylguanine–DNA methyltransferase
gene promoter, which carries a better prognosis.
Figure 7. Pseudoprogression shown in post-contrast fluid-attenuation
inversion recovery (FLAIR) fat suppression (FS)
sequences (a, c, e, g, and i) and post-contrast T1-weighted
images with FS sequences (b, d, f, h, and j). A 63-year-old
patient with an ill-defined enhancing left parietooccipital tumour
that was compatible with glioblastoma [GB] (arrows in
[a] and [b]) was subsequently removed by near-total excision.
Histology showed glioblastoma with positive O6-methylguanine–DNA methyltransferase methylation. Postoperative magnetic
resonance imaging (MRI) illustrated no gross parenchymal
enhancement (arrows in [c] and [d]). The patient was managed
with combined radiotherapy (RT) and temozolomide (TMZ). Follow-up MRI
performed 4 months (e and f) and 6 months (g and h) after surgery
showed progression of the contrast enhancement with a ‘Swiss
cheese’ appearance (arrows in [f] and [h]) and perilesional FLAIR
hyperintense signals (arrowheads in [e] and [g]). Advanced MRI was
then performed in view of suspicion of pseudoprogression (see
Figure 8). The patient was continued on the same chemotherapy.
Follow-up MRI performed 1 year after completion of the adjuvant
therapy (i and j) demonstrated decreased enhancement and FLAIR
hyperintensities (arrowhead in [i] and arrow in [j]). The constellation
of the findings was compatible with pseudoprogression.
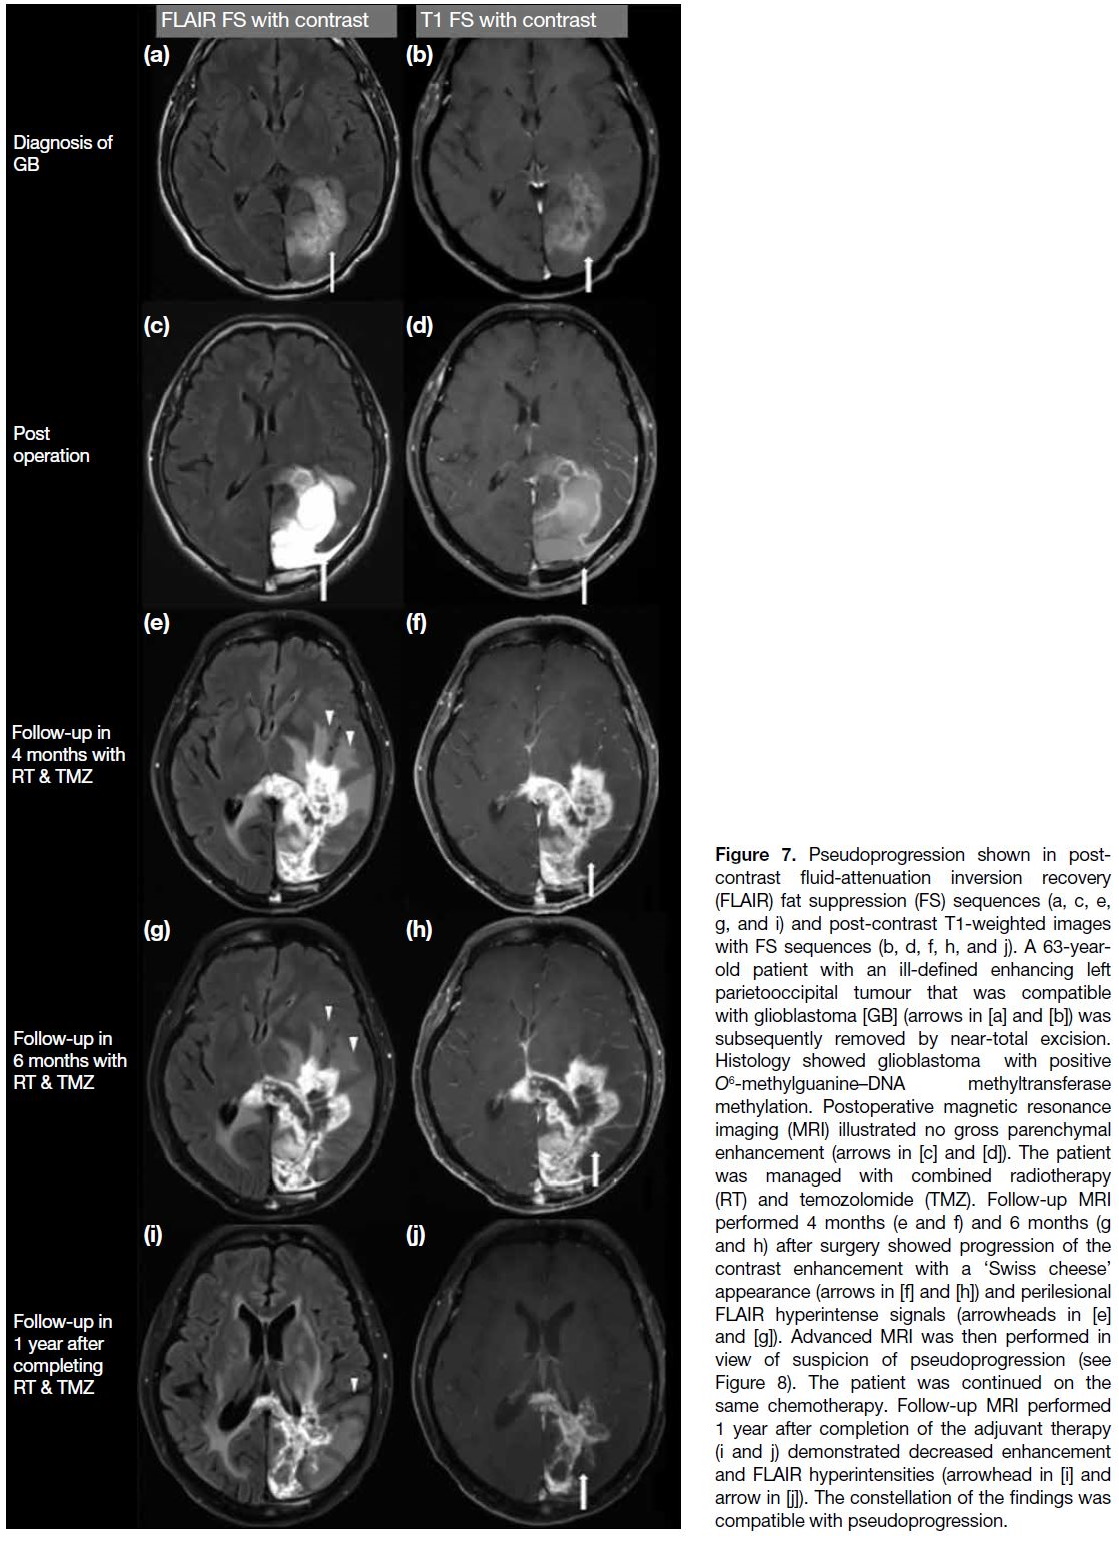
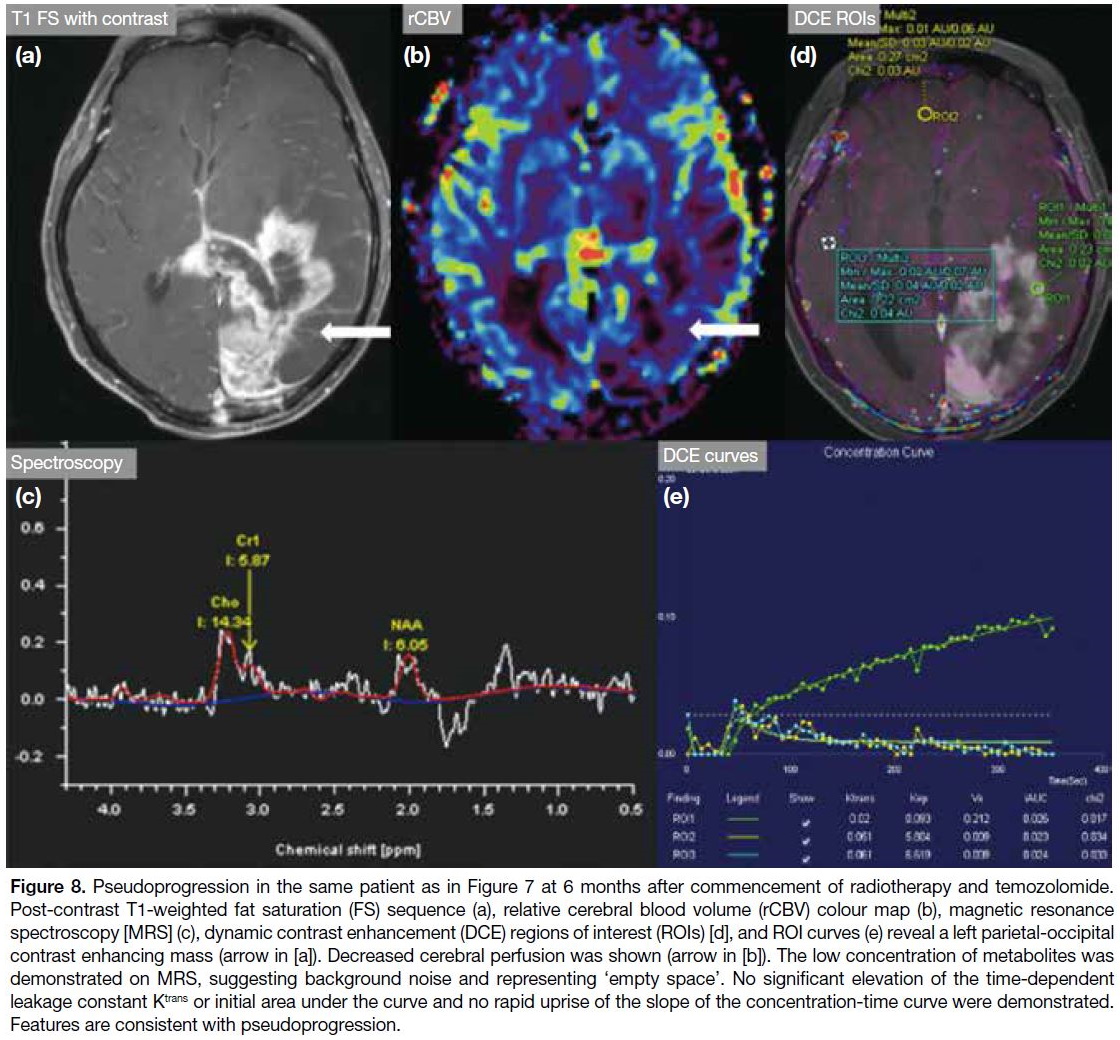
Figure 8. Pseudoprogression in the same patient as in Figure 7 at 6 months after commencement of radiotherapy and temozolomide.
Post-contrast T1-weighted fat saturation (FS) sequence (a), relative cerebral blood volume (rCBV) colour map (b), magnetic resonance
spectroscopy [MRS] (c), dynamic contrast enhancement (DCE) regions of interest (ROIs) [d], and ROI curves (e) reveal a left parietal-occipital
contrast enhancing mass (arrow in [a]). Decreased cerebral perfusion was shown (arrow in [b]). The low concentration of metabolites was
demonstrated on MRS, suggesting background noise and representing ‘empty space’. No significant elevation of the time-dependent
leakage constant Ktrans or initial area under the curve and no rapid uprise of the slope of the concentration-time curve were demonstrated.
Features are consistent with pseudoprogression.
Pseudoprogression is likely the consequence of transient
increase in tumour vasculature and permeability due
to irradiation and is exacerbated by temozolomide.
During the early post-radiotherapy period (usually
around 3-6 months), most new lesions on MRI represent
a mixture of residual tumour and pseudoprogression.
The predominant component will dictate the clinical
and radiological picture over time. Imaging features
during this period might be difficult to interpret even
with the help of advanced MRI techniques. The RANO
criteria suggest that progression can only be determined
<12 weeks after completion of adjuvant chemoradiation
if the new enhancing focus is outside of the high-dose
radiation field or by unequivocal histological findings.[4]
Classically, pseudoprogression presents with a mass of
‘Swiss cheese’ appearance[1] (Figure 7) on conventional
imaging. At 3 to 6 months after the commencement
of chemoradiation, when there are new or progressive
lesions, advanced MRI might potentially aid radiologists
in interpreting these lesions.
Magnetic Resonance Perfusion
Dynamic susceptibility contrast (DSC) and dynamic contrast enhancement (DCE) are the most commonly
used perfusion techniques for assessment of tumour
perfusion. DSC perfusion imaging utilises the
susceptibility gradient from loss of T2* signal secondary
to the passage of contrast through brain tissue and hence
derives the relative cerebral blood volume (rCBV).[1] [6]
High rCBV would suggest the presence of tumour
(Figures 5 and 6) due to their hypervascularity, whereas
low rCBV may represent post-treatment changes (Figure 8).[5]
DCE perfusion involves plotting a contrast signal–time curve, also known as a concentration-time curve,
enhancement-time curve or permeability curve, by estimating the extravasation of contrast from the
intravascular space into the extravascular extracellular
space (EES).[7] Measurements derived from this
permeability curve have been found to provide valuable
clinical information concerning tumour behaviour.
Quantification of enhancement characteristics can be
performed using a range of techniques, from simple
measures of the rate of enhancement to complex
algorithmic analyses that apply pharmacokinetic models
to the imaging data, one of which bears the intention of
measuring the transfer constant of contrast between the
plasma and the EES, i.e., the time-dependent leakage
constant Ktrans.[7] Ktrans is dependent on plasma blood flow,
vascular permeability, and capillary surface area. The slope of the concentration-time curve is therefore one of
the factors in determining the level of this constant.[8] Ktrans
is described to be elevated, compared to that of normal
brain tissue, in tumour progression (Figures 5 and 6) and
reduced in pseudoprogression (Figure 8).[1] [4] [6] However,
detailed discussion on the compartmental models is
beyond the scope of this article.
The concentration-time curve derived from the DCE perfusion consists of two phases, namely the initial
vascular phase and the subsequent delayed equilibrium
phase.[9] The initial upslope reflects early enhancement,
mostly from the contrast agent in the blood vessels and
early leakage into the EES due to disrupted blood-brain
barrier, which is again dependent on blood flow and
vascular surface area. On the other hand, the delayed
equilibrium phase includes mostly delayed permeability
and slow accumulation of contrast agent into the EES, depending on the backflow of contrast agent into the
intravascular compartment. These factors are affected
by the volume of EES, interstitial pressure, and total
vascular area.
Compared to treatment-induced necrosis, recurrent or
progressive brain tumour shows an elevated maximum
slope in the initial vascular phase due to increased blood
flow from neo-angiogenesis.[9] The slope of the delayed
equilibrium phase is higher in treatment-induced necrosis
as a result of low cellularity and more tissue damage,
allowing more retention of contrast in the EES and less
backflow to the intravascular compartment, resulting in
reduced washout.[9]
The area under the curve (AUC) of the concentration-time
curve can also help differentiate between recurrent
tumour and radiation necrosis. The initial AUC (iAUC)
is found to be higher in recurrent tumour than in radiation
necrosis, as a result of neovascularity in the tumour.[9] The ratio of iAUC to final AUC (defined as between
320 and 350 seconds after contrast agent arrival in the
same enhancing voxel of interest as iAUC) is found to
be elevated in recurrent tumours compared to radiation
necrosis, explained by the fact that high vascularity in
recurrent tumour results in elevated iAUC while more
retention of contrast in the EES due to low cellularity and
more tissue damage in radiation necrosis contributes to
higher final AUC.[10]
Non-contrast MR perfusion techniques, including arterial
spin-labelling, can serve as an alternative to DCE and
DSC.[1] [6] They measure cerebral blood flow by labelling
arterial water as the tracer and might be performed
in patients in whom gadolinium-based contrast is
contraindicated.
These techniques appear promising, but currently there is
no established cut-off value that can reliably differentiate
between tumour progression and treatment response.
Magnetic Resonance Spectroscopy
MRS reflects the concentration of brain metabolites based
on their precession frequency; representative metabolites
include N-acetylaspartate (NAA, marker of neuronal
viability) and choline (Cho, marker of cell proliferation).
Viable tumours typically demonstrate an elevated Cho
peak and reduced NAA level[1] (Figures 5 and 6), while
treatment-related injury classically reveals decreased
Cho and NAA peaks, respectively, and an elevated lipid/lactate peak (Figure 8).[6] Lack of external validation and
technical difficulty in evaluating peripheral brain lesions
may limit its potential benefits on post-treatment brain
tumour imaging interpretation.
PSEUDORESPONSE
Antiangiogenic agents, such as bevacizumab,
antagonise the vascular endothelial growth factor
receptors to produce an antitumour effect. It is considered a second-line treatment if patients fail the Stupp
protocol. It can result in rapid and promising reduction
in contrast enhancement but has less effect on non-enhancing
infiltrative disease on neuroimaging.[1] [4] This
discrepancy is characteristic of pseudoresponse (Figure 9). Clinical symptoms and signs may improve after
the antiangiogenic agents, but survival benefit remains
controversial.[4]
Figure 9. Pseudoresponse shown in post-contrast T1-weighted fat suppression (FS) sequence images (a, d, g, and j), post-contrast fluid-attenuation
inversion recovery (FLAIR) FS sequence images (b, e, h, and k), and apparent diffusion coefficient (ADC) map images (c, f, i, and
l). Disease progression was identified in a 66-year-old patient with a histology-proven left frontal glioblastoma managed with chemotherapy,
presenting with a left frontal contrast-enhancing lesion (arrow in [a]) with perilesional FLAIR hyperintensity (arrowhead in [b]) and low ADC
value (thin arrow in [c]). Second-line treatment with bevacizumab was started and follow-up magnetic resonance imaging (MRI) performed 4 months
later (d to f) showed reduction in contrast enhancement (arrows in [d] and [e]). There was no significant interval change in the perilesional FLAIR
hyperintensities (arrowhead in [e]) and low ADC value (thin arrow in [f]) at the left frontal lesion was observed. MRI performed 9 months from
commencement of bevacizumab (g to i) demonstrated further reduction in contrast enhancement (arrows in [g] and [h]). Further increase in
FLAIR hyperintensities (arrowhead in [h]) and persistent low ADC value (thin arrow in [i]) were illustrated. The treatment regime was continued
and disease progression was found in subsequent follow-up MRI (j to l) with increase in contrast enhancement (arrows in [j] and [k]), FLAIR
hyperintense signals (arrowheads in [k]), and a new focus of low ADC signal (thin arrows in [l]). The findings are suggestive of pseudoresponse.

RADIATION NECROSIS
Radiation necrosis, as the name implies, refers to a
delayed necrotic injury of either tumour or normal brain
parenchyma, secondary to high radiation exposure
as in radiosurgery or high-dose radiotherapy. Most
radiation necrosis occurs within a few years after the
irradiation.[11] A combination of fibrinoid changes in
blood vessels, coagulative necrosis, demyelination, and
gliosis can be found on histology. Concomitant use of
chemotherapy, targeted therapy for brain metastasis,
or immunotherapy may increase the risk of treatment-related
necrosis.[11] The typical imaging appearance
includes new enhancement at the resection margin
that was irradiated at a higher dosage (Figure 10),
new periventricular enhancement that lies within the
high-dose radiation field, and new distant enhancement
within the radiation field but not at the expected sites
of tumour spread.[8] On conventional imaging, these can present as a soap-bubble or cut-pepper–like lesion
(Figure 10).
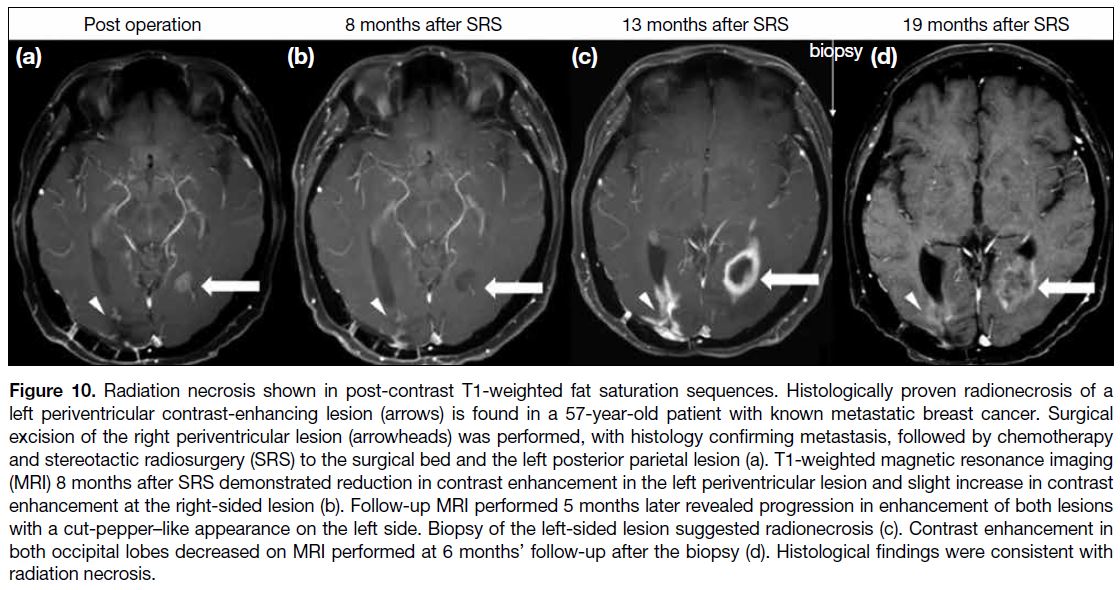
Figure 10. Radiation necrosis shown in post-contrast T1-weighted fat saturation sequences. Histologically proven radionecrosis of a
left periventricular contrast-enhancing lesion (arrows) is found in a 57-year-old patient with known metastatic breast cancer. Surgical
excision of the right periventricular lesion (arrowheads) was performed, with histology confirming metastasis, followed by chemotherapy
and stereotactic radiosurgery (SRS) to the surgical bed and the left posterior parietal lesion (a). T1-weighted magnetic resonance imaging (MRI)
image 8 months after SRS demonstrated reduction in contrast enhancement in the left periventricular lesion and slight increase in contrast
enhancement at the right-sided lesion (b). Follow-up MRI performed 5 months later revealed progression in enhancement of both lesions
with a cut-pepper–like appearance on the left side. Biopsy of the left-sided lesion suggested radionecrosis (c). Contrast enhancement
in both occipital lobes decreased on MRI performed at 6 months’ follow-up after the biopsy (d). Histological findings were consistent with radiation
necrosis.
On advanced MRI, radiation necrosis can demonstrate
reduced rCBV and low permeability on perfusion
imaging. Low NAA and Cho peaks and an elevated
lipid/lactate peak are classical features observed on MRS
(Figure 11).[12]
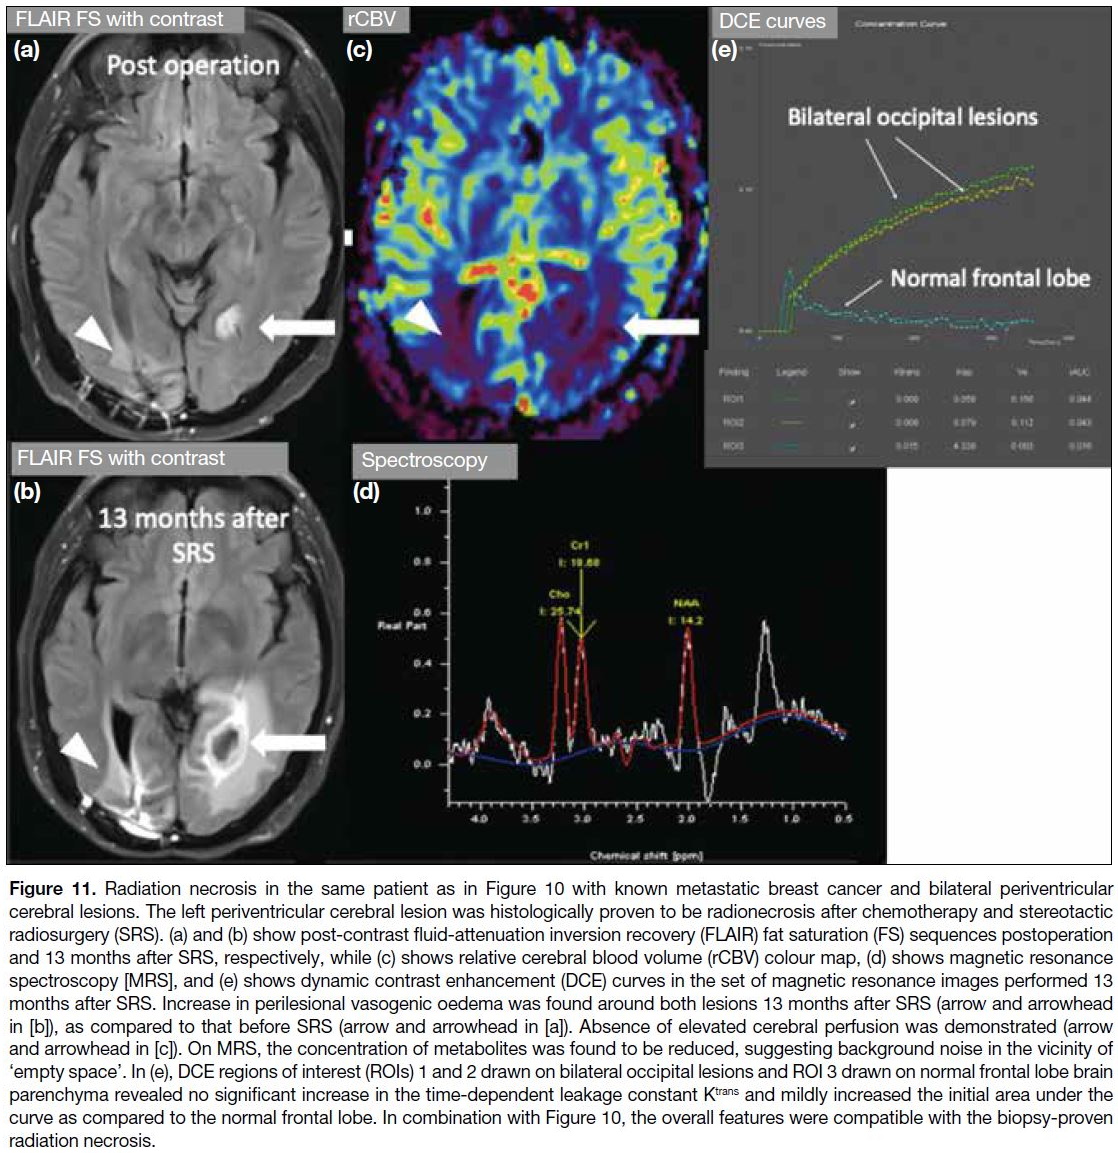
Figure 11. Radiation necrosis in the same patient as in Figure 10 with known metastatic breast cancer and bilateral periventricular
cerebral lesions. The left periventricular cerebral lesion was histologically proven to be radionecrosis after chemotherapy and stereotactic
radiosurgery (SRS). (a) and (b) show post-contrast fluid-attenuation inversion recovery (FLAIR) fat saturation (FS) sequences postoperation
and 13 months after SRS, respectively, while (c) shows relative cerebral blood volume (rCBV) colour map, (d) shows magnetic resonance
spectroscopy [MRS], and (e) shows dynamic contrast enhancement (DCE) curves in the set of magnetic resonance images performed 13
months after SRS. Increase in perilesional vasogenic oedema was found around both lesions 13 months after SRS (arrow and arrowhead
in [b]), as compared to that before SRS (arrow and arrowhead in [a]). Absence of elevated cerebral perfusion was demonstrated (arrow
and arrowhead in [c]). On MRS, the concentration of metabolites was found to be reduced, suggesting background noise in the vicinity of
‘empty space’. In (e), DCE regions of interest (ROIs) 1 and 2 drawn on bilateral occipital lesions and ROI 3 drawn on normal frontal lobe brain
parenchyma revealed no significant increase in the time-dependent leakage constant Ktrans and mildly increased the initial area under the
curve as compared to the normal frontal lobe. In combination with Figure 10, the overall features were compatible with the biopsy-proven
radiation necrosis.
STROKE-LIKE MIGRAINE ATTACKS AFTER RADIATION THERAPY SYNDROME
Stroke-like migraine attacks after radiation therapy
(SMART) syndrome is a rare, recurrent, and late
complication of irradiation with partial to complete
recovery.[13] It is more commonly seen in men and
clinical presentation includes migraine-like headache,
stroke-like focal neurological deficit, and seizures. The
pathophysiology is not well understood but proposed
mechanisms include cerebral hyperexcitability with
impaired autoregulation and endothelial damage as
well as reversible radiation-induced vasculopathy. No
pathological correlation has been identified on brain
biopsy so far and no consensus on effective treatment
has been established although antiepileptics and steroids
have been used in some of the reported cases of SMART
syndrome.[13]
Classical imaging findings of SMART syndrome
include unilateral cortical gyriform swelling as well as
cortical and dural enhancement with or without diffusion
restriction, typically found in the parietal-temporal-occipital
lobes[13] (Figures 12 and 13). The differential
diagnosis of the combined clinical and radiological
features includes tumour recurrence/leptomeningeal
carcinomatosis, meningoencephalitis, and posterior reversible encephalopathy syndrome (PRES).
Figure 12. Stroke-like migraine attacks after radiation therapy (SMART) syndrome. A 40-year-old patient with history of treated right parietal
glioblastoma and stable disease for >5 years presented with headache, seizure, and left hemiplegia. MRI with a post-contrast T1-weighted
fat suppression (FS) sequence (a), post-contrast fluid-attenuation inversion recovery (FLAIR) FS sequence (b), and apparent diffusion
coefficient (ADC) imaging (c) demonstrated gyriform contrast enhancement and gyral oedema in the right frontal-parietal-occipital cortex
with low ADC values (arrows). Incidental note was made of shunt-related diffuse bilateral pachymeningeal enhancement (arrowheads in [a]
and [b]) with a left ventriculoperitoneal shunt in situ (thin arrows in [b], [d], and [e]). Follow-up post-contrast T1-weighted FS sequence (d),
post-contrast FLAIR FS sequence (e), and ADC imaging (f) when the symptoms subsided revealed improvement in the dural enhancement
(arrowheads in [d] and [e]) and gyral swelling with normal ADC signal. Features are in keeping with SMART syndrome. Interval reduction in
pachymeningeal enhancement and dilatation of the ventricles suggested improvement of overshunting. Incidental finding of an extra axial
cystic lesion at the pineal region was suggestive of an arachnoid cyst (curved arrows in [b] and [e]) which remained stable in size for >5
years.

Figure 13. Stroke-like migraine attacks after radiation therapy
(SMART) syndrome. (a, c, e, g, and i) show post-contrast T1-weighted fat suppression (FS) sequence at the level of lateral
ventricles over time and (b, d, f, h, and j) show post-contrast T1-weighted FS sequence acquired above the ventricles. A 40-yearold
patient presented with an extra-axial right supratentorial
contrast-enhancing mass (thin arrow in [a]), which was proven
to be a haemangiopericytoma, was treated with total excision (a
and b) followed by adjuvant radiotherapy. No disease recurrence
was identified in follow-up magnetic resonance imaging (MRI)
performed 3 years after the excision (c and d). The patient presented
again with intermittent and reversible left-hand weakness and
numbness and seizures 5 years after the operation. MRI (e and f)
demonstrated gyriform and leptomeningeal enhancement involving
the right cerebral hemisphere (arrows). Follow-up MRI performed
6 months later when symptoms subsided (g and h) illustrated
radiological improvement of the contrast enhancement (arrows in
[g]). However, symptoms recurred shortly after the MRI and rescan
in 1 week showed new leptomeningeal enhancement at the high
right frontoparietal lobe (arrows in [i] and [j]). Overall features are
most compatible with recurrent SMART syndrome.

Similar to SMART syndrome, PRES commonly
manifests as a reversible entity without designated
treatment.[14] The pathophysiology of PRES is postulated
to be cerebral hyperperfusion from insufficient
autoregulation secondary to rapidly developing
hypertension and activation of cytokines and
inflammatory responses due to systemic disorders such
as autoimmune disorders, cytotoxic drugs or sepsis.[5] The typical imaging features of PRES include vasogenic
oedema in the bilateral parietal-occipital subcortical
white matter, while contrast enhancement and restricted
diffusion may be present in up to 20% to 30% of patients,[15]
as opposed to the unilaterality and predominant cortical
involvement of SMART syndrome, which usually aids
in radiological differentiation from PRES.
RADIATION-INDUCED NEOPLASM
Radiation-induced tumour is generally defined as a secondary neoplasm of different histology, developing in
the radiation field after an asymptomatic latency period.
Meningioma is the most common radiation-induced
central nervous system tumour and World Health
Organization grade I meningioma is the most common
subtype (Figure 14).[16] The overall survival is comparable
to that of de novo meningiomas with similar grades.[17]
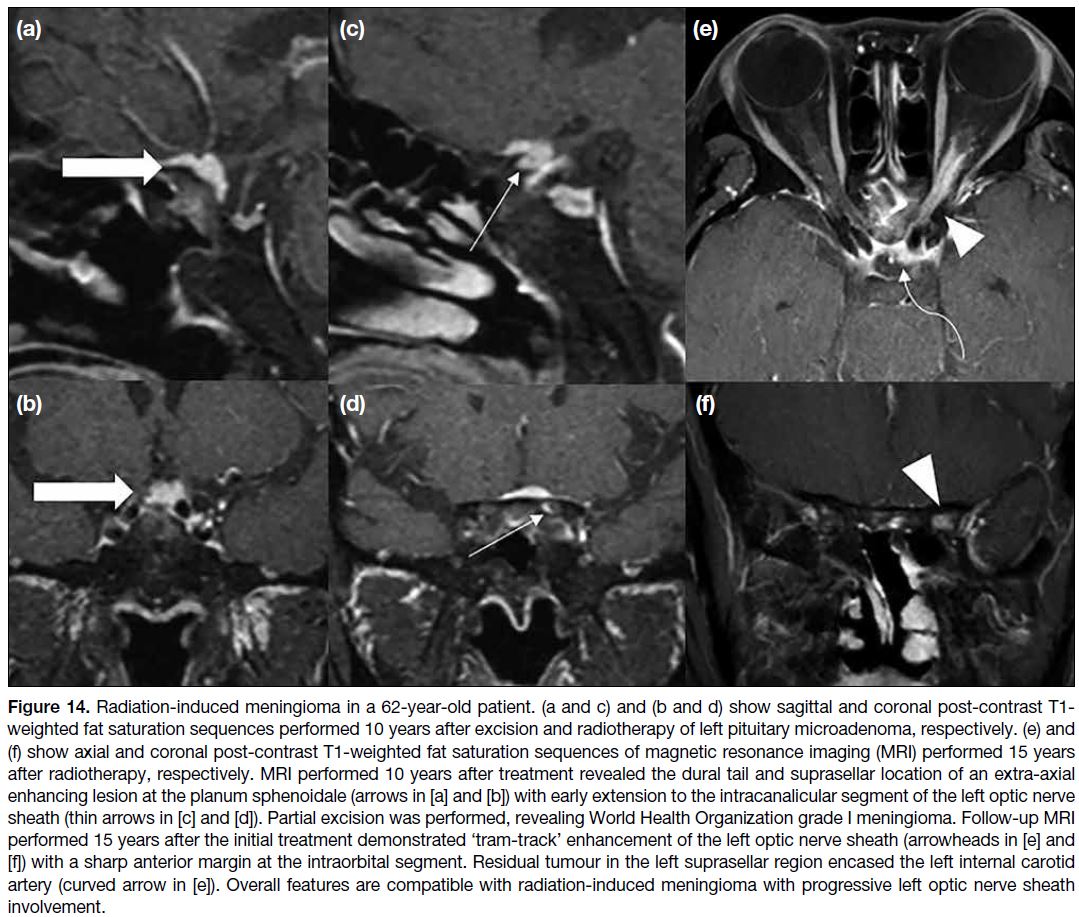
Figure 14. Radiation-induced meningioma in a 62-year-old patient. (a and c) and (b and d) show sagittal and coronal post-contrast T1-weighted fat saturation sequences performed 10 years after excision and radiotherapy of left pituitary microadenoma, respectively. (e) and
(f) show axial and coronal post-contrast T1-weighted fat saturation sequences of magnetic resonance imaging (MRI) performed 15 years after radiotherapy, respectively.
MRI performed 10 years after treatment revealed the dural tail and suprasellar location of an extra-axial enhancing lesion at the planum
sphenoidale (arrows in [a] and [b]) with early extension to the intracanalicular segment of the left optic nerve sheath (thin arrows in [c] and
[d]). Partial excision was performed, revealing World Health Organization grade I meningioma. Follow-up MRI performed 15 years after the
initial treatment demonstrated ‘tram-track’ enhancement of the left optic nerve sheath (arrowheads in [e] and [f]) with a sharp anterior margin
at the intraorbital segment. Residual tumour in the left suprasellar region encased the left internal carotid artery (curved arrow in [e]). Overall
features are compatible with radiation-induced meningioma with progressive left optic nerve sheath involvement.
Acute to Subacute Radiation-Induced Injury
Acute radiation encephalopathy can occur in days to
weeks after irradiation, due to alterations in capillary
permeability, disruption of the blood-brain barrier,
and development of vasogenic oedema. Clinical
manifestations may include acute neurological symptoms such as nausea, vomiting, drowsiness, headache, or acute
worsening of pre-existing neurological symptoms.[11]
Diffuse brain swelling, T2-weighted hyperintensity in
the white matter, or new or enlarged contrast-enhancing
lesions in the vicinity of irradiation can be demonstrated
on MRI. Corticosteroids may be helpful to control
patients’ signs and symptoms.[11]
RADIATION-INDUCED LEUCOENCEPHALOPATHY
Radiation-induced leucoencephalopathy generally refers
to delayed radiation-induced white matter injury with
a reported incidence of up to 34% in patients receiving
lower radiation dosages, e.g., in whole-brain radiotherapy. The mechanisms of this leucoencephalopathy include
damage to the oligodendrocytes, resulting in axonal
demyelination, disruption of vascular endothelium, and
focal mineralisation.[11] Patients may be asymptomatic or
present with varying degrees of neurocognitive decline.
Imaging features typically include progressive symmetric
and confluent T2/FLAIR hyperintense signals mainly
in the periventricular white matter and brain atrophy
(Figure 15).[6]
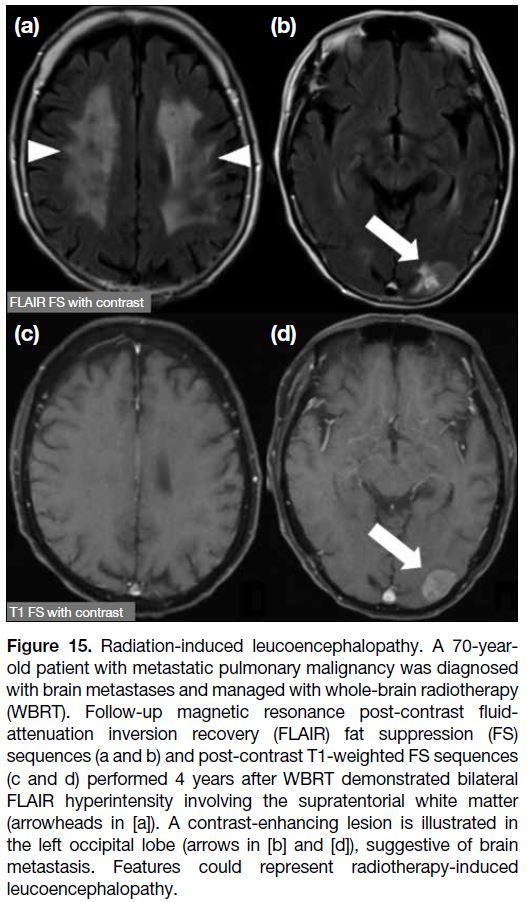
Figure 15. Radiation-induced leucoencephalopathy. A 70-year-old
patient with metastatic pulmonary malignancy was diagnosed
with brain metastases and managed with whole-brain radiotherapy
(WBRT). Follow-up magnetic resonance post-contrast fluid-attenuation
inversion recovery (FLAIR) fat suppression (FS)
sequences (a and b) and post-contrast T1-weighted FS sequences
(c and d) performed 4 years after WBRT demonstrated bilateral
non-enhancing FLAIR hyperintensity involving the supratentorial white matter (arrowheads in [a]). Features could represent radiotherapy-induced leucoencephalopathy. A contrast-enhancing lesion is illustrated in the left occipital lobe (arrows in [b] and [d]), suggestive of brain metastasis.
CONCLUSION
The combination of conventional and advanced MRI
techniques in post-treatment brain tumour imaging
aids radiologists in distinguishing between treatment
response and treatment-related changes and recognising
post-treatment complications. Familiarity with these techniques might help to avoid unnecessary alteration of
the patients’ management or invasive procedures.
REFERENCES
1. Leao DJ, Craig PG, Godoy LF, Leite CC, Policeni B. Response assessment in neuro-oncology criteria for gliomas: practical approach using conventional and advanced techniques. AJNR Am
J Neuroradiol. 2020;41:10-20. Crossref
2. Stupp R, Mason WP, van den Bent MJ, Weller M, Fisher B, Taphoorn MJ, et al. Radiotherapy plus concomitant and adjuvant
temozolomide for glioblastoma. N Engl J Med. 2005;352:987-96. Crossref
3. Stupp R, Taillibert S, Kanner A, Read W, Steinberg D, Lhermitte B, et al. Effect of tumor-treating fields plus maintenance temozolomide vs maintenance temozolomide alone on survival in patients with glioblastoma: a randomized clinical trial. JAMA. 2017;318:2306-
16. Crossref
4. Wen PY, Macdonald DR, Reardon DA, Cloughesy TF, Sorensen AG, Galanis E, et al. Updated response assessment criteria for high-grade gliomas: response assessment in Neuro-Oncology Working Group. J Clin Oncol. 2010;28:1963-72. Crossref
5. Prager AJ, Maritnez N, Beal K, Omuro A, Zhang Z, Young RJ. Diffusion and perfusion MRI to differentiate treatment-related changes including pseudoprogression from recurrent tumors in
high-grade gliomas with histopathologic evidence. AJNR Am J
Neuroradiol. 2015;36:877-85. Crossref
6. Kessler AT, Bhatt AA. Brain tumour post-treatment imaging and treatment-related complications. Insights Imaging. 2018;9:1057-75. Crossref
7. Jackson A, Jayson GC, Li KL, Zhu XP, Checkley DR, Tessier JJ, et al. Reproducibility of quantitative dynamic contrast-enhanced MRI in newly presenting glioma. Br J Radiol. 2003;76:153-62. Crossref
8. Heye AK, Culling RD, Valdés Hernández MdC, Thrippleton MJ, Wardlaw JM. Assessment of blood-brain barrier disruption using dynamic contrast-enhanced MRI. A systematic review. Neuroimage
Clin. 2014;6:262-74. Crossref
9. Narang J, Jain R, Arbab AS, Mikkelsen T, Scarpace L, Rosenblum ML, et al. Differentiating treatment-induced necrosis from recurrent/progressive brain tumor using non-model–based
semiquantitative indices derived from dynamic contrast-enhanced
T1-weighted MR perfusion. Neuro Oncol. 2011;13:1037-46. Crossref
10. Chung WJ, Kim HS, Kim N, Choi CG, Kim SJ. Recurrent glioblastoma: optimum area under the curve method derived from
dynamic contrast-enhanced T1-weighted perfusion MR imaging.
Radiology. 2013;269:561-8. Crossref
11. Katsura M, Sato J, Akahane M, Furuta T, Mori H, Abe O. Recognizing radiation-induced changes in the central nervous
system: where to look and what to look for. Radiographics.
2021;41:224-48. Crossref
12. Kumar AJ, Leeds NE, Fuller GN, Van Tassel P, Maor MH, Sawaya RE, et al. Malignant gliomas: MR imaging spectrum of
radiation therapy- and chemotherapy-induced necrosis of the brain
after treatment. Radiology. 2000;217:377-84. Crossref
13. Black DF, Morris JM, Lindell EP, Krecke KN, Worrell GA, Barleson JD, et al. Stroke-like migraine attacks after radiation therapy (SMART) syndrome is not always completely reversible:
a case series. AJNR Am J Neuroradiol. 2013;34:2298-303. Crossref
14. Patel UK, Patel K, Malik P, Elkady A, Patel Nidhi, Lunagariya A. Stroke-like migraine attacks after radiation therapy (SMART) syndrome—a case series and review. Neurol Sci. 2020;41:3123-34. Crossref
15. Fugate JE, Rabinstein AA. Posterior reversible encephalopathy syndrome: clinical and radiological manifestations, pathophysiology, and outstanding questions. Lancet Neurol. 2015;14:914-25. Crossref
16. Yamanaka R, Hayano A, Kanayama T. Radiation-induced meningiomas: an exhaustive review of the literature. World
Neurosurg. 2017;97:635-44.e8. Crossref
17. Lee JW, Wernicke AG. Risk and survival outcomes of radiation-induced CNS tumors. J Neurooncol. 2016;129:15-22. Crossref