
Effects of Different Liver Diseases on Metabolic Reference in 18F-Fluorodeoxyglucose Positron Emission Tomography/Computed Tomography
ORIGINAL ARTICLE CME
Hong Kong J Radiol 2023 Dec;26(4):240-7 | Epub 11 Dec 2023
Effects of Different Liver Diseases on Metabolic Reference in 18F-Fluorodeoxyglucose Positron Emission Tomography/Computed Tomography
KS Ng, KK Ng, KS Chu, BT Kung, TK Au Yong
Nuclear Medicine Unit, Queen Elizabeth Hospital, Hong Kong SAR, China
Correspondence: Dr KS Ng, Nuclear Medicine Unit, Queen Elizabeth Hospital, Hong Kong SAR, China. Email: nks176@ha.org.hk
Submitted: 13 Jan 2022; Accepted: 10 May 2022.
Contributors: KSN designed the study, acquired the data, analysed the data and drafted the manuscript. KKN, KSC, BTK and TKAY critically
revised the manuscript for important intellectual content. All authors had full access to the data, contributed to the study, approved the final
version for publication, and take responsibility for its accuracy and integrity.
Conflicts of Interest: As editors of the journal, KSN and TKAY were not involved in the peer review process. Other authors have disclosed no conflicts of interest.
Funding/Support: This research received no specific grant from any funding agency in the public, commercial, or not-for-profit sectors.
Data Availability: All data generated or analysed during the present study are available from the corresponding author on reasonable request.
Ethics Approval: The study was approved by the Queen Elizabeth Hospital Research Ethics Committee of Hospital Authority, Hong Kong (Ref No.: KC/KE-19-0048-ER-4). Informed patient consent was waived by the Committee due to the retrospective nature of the study.
Abstract
Introduction
In addition to visual assessment, measuring standardised uptake values (SUVs) in 18F-fluorodeoxyglucose
positron emission tomography/computed tomography (18F-FDG PET/CT) for extrahepatic lesion characterisation
often uses comparisons with normal liver and blood pool uptake as metabolic references. However, the effects of
liver diseases on these metabolic references are not well understood. This study therefore aimed to investigate how
different liver diseases affect 18F-FDG uptake in the liver and the blood pool.
Methods
A total of 168 patients who underwent 18F-FDG PET/CT in our institution were retrospectively evaluated.
The mean SUVs in the liver and blood pool were measured. Based on their clinical history and investigation results,
patients were categorised into the following five groups: normal liver, hyperbilirubinaemia, cirrhosis, steatosis, and
polycystic liver disease. The mean liver-to–blood pool SUV ratios of the different groups were statistically analysed
using t tests and linear regression.
Results
Compared with the control group, patients with hyperbilirubinaemia were associated with a higher mean
lesion SUV, while those with cirrhosis, steatosis, and polycystic liver disease had lower ratios. Increasing severity
of steatosis correlated with decreasing SUV. All results were statistically significant.
Conclusion
This study demonstrates that liver diseases can affect lesion SUV in proportion to their severity.
Radiologists should review the underlying hepatic conditions of patients before using liver and blood pool as
references for 18F-FDG measurements.
Key Words: Fluorodeoxyglucose F18; Liver; Positron-emission tomography
中文摘要
不同肝臟疾病對18F-氟脫氧葡萄糖正子斷層掃描/電腦斷層掃描代謝參考的影響
吳國勝、吳官橋、朱競新、龔本霆、歐陽定勤
簡介
除了視覺評估之外,測量18F-氟脫氧葡萄糖正子斷層掃描/電腦斷層掃描(18F-FDG PET/CT)中的標準化攝取值(SUV)來表徵肝外病變特徵通常使用與正常肝臟和血池攝取的比較作為代謝參考。然而,肝臟疾病對這些代謝參考的影響尚不清楚。因此,本研究旨在調查不同的肝臟疾病如何影響肝臟和血池中18F-FDG的攝取。
方法
本研究對在本院接受18F-FDG PET/CT檢查的168位患者進行回顧性分析,並測量其肝臟和血池中的平均SUV。根據患者的臨床病史和檢查結果,我們將患者分為以下五組:正常肝臟、高膽紅素血症、肝硬化、脂肪變性和多囊性肝病。我們使用t檢定和線性迴歸對不同組別的平均肝臟與血池SUV比率進行統計分析。
結果
與對照組相比,高膽紅素血症患者的平均病變SUV值較高,而肝硬化、脂肪變性和多囊性肝患者的平均病變SUV值較低。脂肪變性嚴重程度的增加與 SUV的減少有關。所有結果均具有統計意義。
結論
本研究表明,肝臟疾病對病變SUV的影響與其嚴重程度成正比。在使用肝臟和血池作為18F-FDG測量的參考之前,放射科醫生應檢查患者的潛在肝臟狀況。
INTRODUCTION
Both semiquantitative assessment and qualitative visual
interpretation are applied in 18F-fluorodeoxyglucose
positron emission tomography/computed tomography
(18F-FDG PET/CT) for lesion characterisation.[1] In the
semiquantitative approach, the maximum standardised
uptake value (SUVmax) is calculated, but this depends
on multiple factors, including injection time, uptake
period, and blood glucose level.[2] Thus, it is difficult to
compare the absolute SUVmax between different PET/CT
systems.[2] For qualitative visual interpretation, the
18F-FDG uptake of a lesion is typically graded with respect
to mean blood pool and liver uptake of a patient (e.g.,
score 1: no uptake; 2: less than or equal to blood pool; 3:
between blood pool and liver; 4: moderately more than
liver; and 5: markedly more than liver[3]). This approach is
useful in lesion delineation: a lesion is generally regarded
as genuine (i.e., the lesion is true instead of false positive)
if its uptake is higher than that of liver and not genuine if
its uptake is less than or equal to that of blood pool. This
is also useful in treatment response assessment (e.g., a
disease is likely deteriorating if the score increases in
interval scan). Visual interpretation is the recommended
method in different guidelines, including the Deauville
criteria for high-grade lymphoma,[3] PERCIST (Positron Emission Tomography Response Criteria in Solid
Tumors) 1.0 for solid tumours proposed by the Society
of Nuclear Medicine and Molecular Imaging,[4] [5] as well
as for vasculitis assessment developed by the European
Association of Nuclear Medicine and the Society of
Nuclear Medicine and Molecular Imaging.[6] Ideally, blood
pool and liver uptake should have minimal variability such
that they can be utilised as reliable metabolic references.
There are existing procedural protocols standardising
patient preparation and acquisition techniques.[7] The aim
of this study was to evaluate the liver and blood pool
uptake in different liver diseases (hyperbilirubinaemia,
cirrhosis, steatosis, and polycystic liver disease) and
their potential effect on lesion assessment. Focal liver
diseases (e.g., hepatocellular carcinoma and liver
metastasis) were not included here as their effects have
already been covered in the literature,[8] and we believe
that general hepatic metabolism is likely more dependent
on systemic liver diseases than focal liver pathologies.
Throughout this research, the ratio between the mean
SUV of the liver and that of the blood pool (SUVliver/SUVblood pool ratio) instead of absolute SUV was evaluated
because the ratio was more relevant to the grading.
Mean SUV (SUVmean), instead of SUVmax, of liver and
blood pool was investigated as an analogue of visual
interpretation.
METHODS
Patient Recruitment
Cases of patients who underwent whole-body 18F-FDG
PET/CT in our centre from 1 January 2011 to 31 December
2015 were retrospectively reviewed. The clinical
background and investigation results were reviewed,
including drinking history, blood test results, radiological
images, and endoscopic findings. Continuous data were
reported as mean ± standard deviation. Subjects were
excluded if: (1) liver malignancy had been diagnosed
histologically; or (2) liver malignancy was suspected
radiologically (e.g., by 18F-FDG PET/CT, ultrasound,
CT or magnetic resonance imaging) within 12 weeks
of 18F-FDG PET/CT imaging; or (3) no liver function
tests were available within 2 weeks of 18F-FDG PET/CT
imaging; or (4) blood glucose level was > 11 mmol/L
before 18F-FDG PET/CT acquisition.
A total of 168 adult patients (56.5% male, 43.5%
female) with a mean age of 62.3 ± 13.4 years were
included. The majority had undergone 18F-FDG PET/CT
for oncological indications: lung (23.2%), lymphoma
(14.8%), breast (12.5%), biliary (9.5%), colon (8.3%),
renal (6.0%), and other (12.6%) cancers. Some of the
subjects (13.1%) showed no evidence of malignancy
after thorough workup. Each case was then assigned to
one of the following five groups (Table 1):
Table 1. Characteristics of the five groups (n = 168)
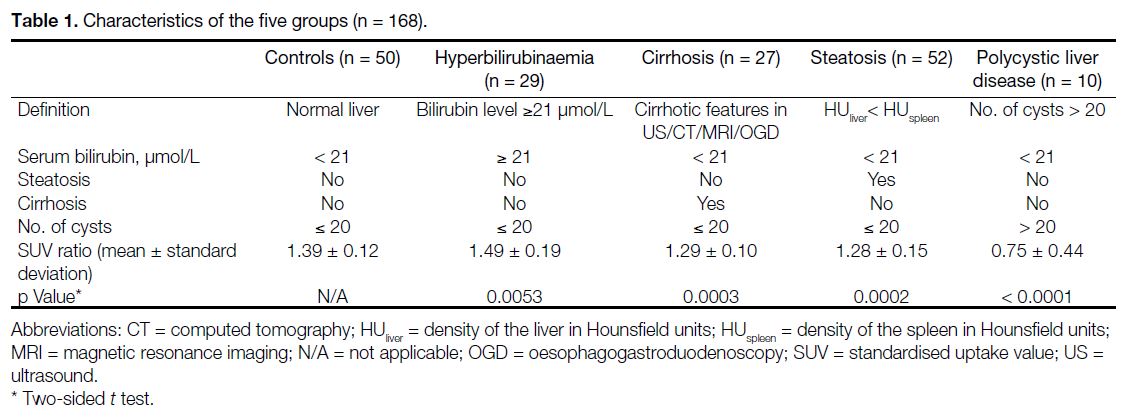
(1) The control group (n = 50): liver function (i.e.,
serum bilirubin, alanine aminotransferase, aspartate
aminotransferase and alkaline phosphatase levels)
was normal, and there was no evidence of cirrhosis,
steatosis or polycystic liver disease;
(2) the hyperbilirubinaemia group (n = 29): the serum bilirubin level was greater than or equal to the upper limit of the normal level (21 μmol/L) within 2 weeks of 18F-FDG PET/CT acquisition, and there was no evidence of cirrhosis, steatosis or polycystic liver disease;
(3) the cirrhosis group (n = 27): features of cirrhosis had been documented by means of imaging (e.g., ultrasound, CT or magnetic resonance imaging) or oesophagogastroduodenoscopy. Liver function was normal, and there was no evidence of steatosis or polycystic liver disease;
(4) the steatosis group (n = 52): the mean liver density in Hounsfield units (HUliver) on CT was lower than that of the spleen (HUspleen). As SUV measurement is potentially dependent on the distribution of steatosis (e.g., diffuse, focal, multinodular, etc.), this study focused on the patients with diffuse steatosis. Liver function was normal, and there was no evidence of cirrhosis or polycystic liver disease; and
(5) the polycystic liver disease group (n = 10): the liver contained > 20 cysts as defined in the literature.[9] Liver function was normal, and there was no evidence of cirrhosis or steatosis.
Technical Aspects
All 18F-FDG FDG PET-CT examinations were
performed with the same PET/CT scanner (Discovery
710; General Electric, Milwaukee [WI], United States).
The mean 18F-FDG activity administered was 407.0
± 45.5 MBq. After a mean uptake time of 59.8 ± 6.21
minutes, PET data were acquired from skull vertex to
mid thighs in seven to eight bed positions (3 minutes
per bed position) with mean axial bed coverage of
15.2 cm per bed and 9-slice bed overlap in twodimensional
acquisition mode. Reconstruction
using Optimization of Ordered Subset Expectation
Maximization was performed with 4.2-mm section
thickness in a 128 × 128 matrix and processed through a
standard filter. Non-contrast CT data were acquired for
anatomical correlation and attenuation correction.
Measurements and Statistical Analyses
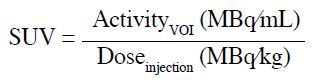
The SUV is defined as the activity measured in a volume
of interest (VOI) divided by the injected 18F-FDG dose,
based on body weight[10]:
SUVliver was measured in a 3-cm–diameter spherical VOI over the right lobe of the liver as recommended in
the PERCIST 1.0 criteria.[4] [5] No observable lesion was
included in the liver VOI, except for the unavoidable
multiple cysts in polycystic liver disease. SUVblood pool was
measured in another spherical VOI with diameter > 2 cm
in the descending thoracic aorta. Atherosclerotic plaque
was avoided in the blood pool VOI as the diseased vessel
wall was often 18F-FDG–avid.[4] [5] The mean HU of the
liver and the spleen were recorded in two-dimensional
circular regions of interest with diameters > 3 cm. The
body weight was routinely recorded on the same day of
the 18F-FDG PET/CT acquisition, with mean weight of
63.4 ± 11.7 kg. Statistical analyses, including two-sided
t tests and linear regression, were performed with SPSS
(Windows version 20.0; IBM Corp, Armonk [NY],
United States). The results were regarded as statistically
significant if the corresponding p values were < 0.05.
RESULTS
Figure 1a shows a representative maximum intensity
projection (MIP) of a control case. The 18F-FDG uptake
in the liver (orange arrow) was homogeneous without
discernible hypermetabolic lesions. The degree of uptake
was normal and greater than that in the mediastinal blood
pool (purple arrow), i.e., SUVliver/SUVblood pool ratio > 1, and in the spleen. All of the 50 control cases had SUVliver/SUVblood pool ratios > 1, with a mean SUV ratio of 1.39 (Table 1).
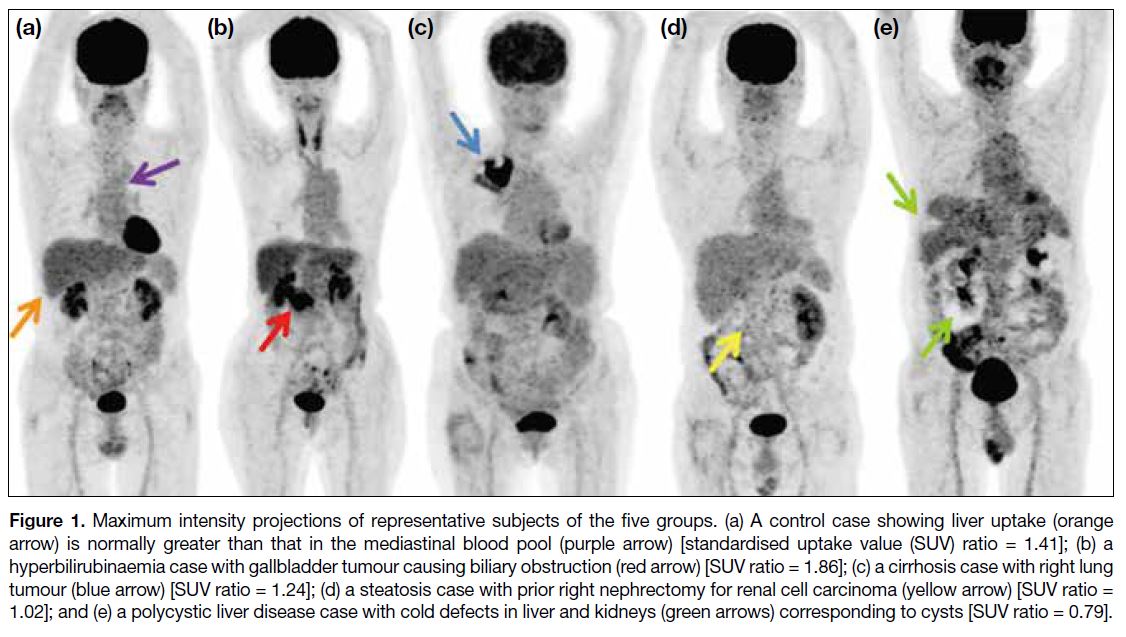
Figure 1. Maximum intensity projections of representative subjects of the five groups. (a) A control case showing liver uptake (orange arrow) is normally greater than that in the mediastinal blood pool (purple arrow) [standardised uptake value (SUV) ratio = 1.41]; (b) a hyperbilirubinaemia case with gallbladder tumour causing biliary obstruction (red arrow) [SUV ratio = 1.86]; (c) a cirrhosis case with right lung tumour (blue arrow) [SUV ratio = 1.24]; (d) a steatosis case with prior right nephrectomy for renal cell carcinoma (yellow arrow) [SUV ratio = 1.02]; and (e) a polycystic liver disease case with cold defects in liver and kidneys (green arrows) corresponding to cysts [SUV ratio = 0.79].
In the hyperbilirubinaemia group, the serum bilirubin level ranged from 23 to 667 μmol/L (mean = 107). Four
cases had elevated aspartate aminotransferase level
(> 47 IU/L), four had elevated alkaline phosphatase
level (> 140 IU/L), and 18 had both enzymes elevated.
Thus, 26 subjects (89.7%) had elevated liver enzyme(s)
in addition to the increased serum bilirubin level. The
hyperbilirubinaemia cases had a mean SUV ratio of 1.49,
which was greater than that of the controls. A two-sided
t test showed that the difference in mean SUV ratios
achieved statistical significance (p = 0.0053; Table 1).
A representative MIP of the hyperbilirubinaemia cases
demonstrates the higher degree of contrast between hepatic and blood pool uptake compared with that of the
controls (Figure 1b). The cause of hyperbilirubinaemia
in Figure 1b was biliary obstruction secondary to a
gallbladder tumour (red arrow). To investigate the
correlation between bilirubin level and the SUV ratio,
linear regression analysis was performed. Figure 2 shows
that the SUV ratio was higher with increasing serum
bilirubin level (black circles, bottom x-axis), with a
corresponding slope of 0.0008 L/μmol and a correlation
coefficient of 0.438. The relationship between serum
bilirubin level and the SUV ratio was further examined
by subdividing the hyperbilirubinaemia cases into two
groups: mild (serum bilirubin level: 21-63 μmol/L, i.e., grade 1 to 2 hyperbilirubinaemia as defined by the
Common Terminology Criteria for Adverse Events
version 5.0[11]) and severe (serum bilirubin level > 63
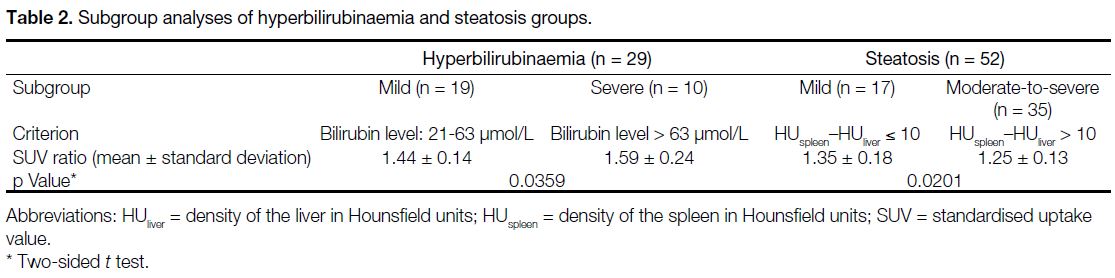
μmol/L, i.e., grade 3 to 4 hyperbilirubinaemia). Table 2
shows that the mild hyperbilirubinaemia cases had a mean
SUV ratio of 1.44, while the severe hyperbilirubinaemia
cases had a mean SUV ratio of 1.59 (p = 0.0359).
Figure 2. Linear regression plots of liver-to–blood pool
standardised uptake value (SUV) ratio against the serum bilirubin
level for the hyperbilirubinaemia cases (black circles, bottom
x-axis) and the difference between the density of the spleen
and the liver in Hounsfield units (HUspleen–HUliver) for the steatosis
cases (grey squares, top x-axis). The hyperbilirubinaemia cases
had a corresponding slope of 0.0008 L/μmoL and a correlation
coefficient of 0.438. The steatosis cases had a corresponding
slope of -0.0062 and a correlation coefficient of 0.209.
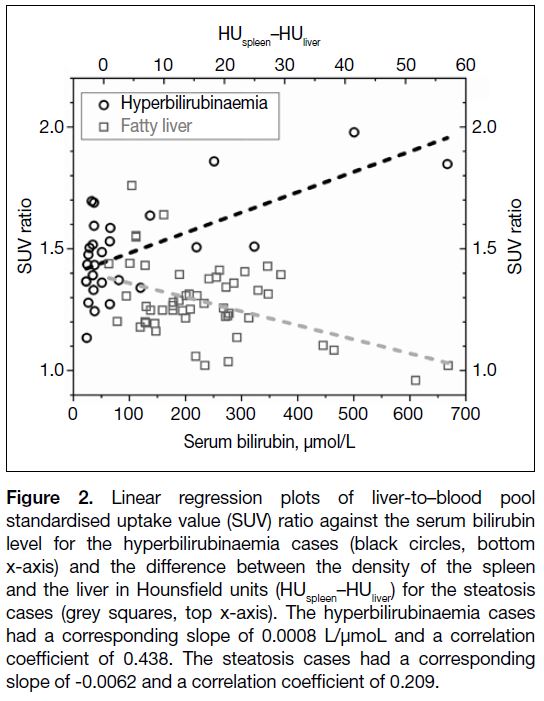
Table 2. Subgroup analyses of hyperbilirubinaemia and steatosis groups
In the cirrhosis cases, 16 out of the 27 (59.3%)
subjects had cirrhotic features documented by
more than one modality (e.g., ultrasound, CT and
oesophagogastroduodenoscopy). Twenty-three (85.2%)
subjects had identifiable causes of cirrhosis (chronic
hepatitis B: 51.9%, hepatitis C: 14.8%, chronic
alcoholism: 18.5%). The cirrhosis cases had a mean
SUV ratio of 1.29, which was less than that of the
controls (p = 0.0003; Table 1). A representative MIP
of a cirrhosis subject in Figure 1c shows that the visual
contrast between liver and blood pool uptake was less
than that of the control cases.
In the steatosis group, the HUliver ranged from 5.5 to 55.2
(mean = 37.2) and the difference between HUspleen and
HUliver (HUspleen–HUliver) ranged from 1 to 57 (mean = 16.6). The steatosis cases had a mean SUV ratio of 1.28,
which was less than that of the controls (p = 0.0002;
Table 1). The mean SUV ratio was still > 1, implying
that liver had greater uptake than the blood pool.
However, individuals with severe steatosis could have
liver uptake as low as that of the blood pool, as illustrated
in Figure 1d. To study if the SUV ratio depended on the
severity of the steatosis, linear regression analysis was
performed. The SUV ratios of the subjects with steatosis
are plotted against the HUspleen–HUliver in Figure 2. It was
observed that the SUV ratios decreased with increasing
HUspleen–HUliver (grey squares, top x-axis). The
corresponding slope in linear regression analysis was
-0.0062 and the correlation coefficient was 0.209. The
relationship between the steatosis severity and the SUV ratio was further evaluated by subdividing the subjects
into mild (HUspleen–HUliver ≤ 10) and moderate-to-severe
(HUspleen–HUliver > 10) steatosis cases in accordance with
Jacobs et al’s study.[12] The mild steatosis cases had a
higher mean SUV ratio of 1.35, while the moderate-to-severe
steatosis cases had a lower mean SUV ratio of
1.25 (p = 0.0201; Table 2).
In the polycystic liver disease group, the mean SUV ratio
was 0.75. This implies that unlike all the other cases
which had mean ratios ≥ 1, the uptake in polycystic liver
was generally less than that in the blood pool (Table 1).
Figure 1e shows the MIP of a case of polycystic liver
disease. The liver uptake was heterogeneous with a
cold spot corresponding to a large hepatic cyst (upper
green arrow). Table 1 shows that the SUV ratio of the
polycystic liver disease cases had the greatest standard
deviation (0.44) among all the cases (control group:
0.12, hyperbilirubinaemia group: 0.19, cirrhosis group:
0.10, steatosis group: 0.15) due to the variabilities in
size, number and distribution of hepatic cysts with no
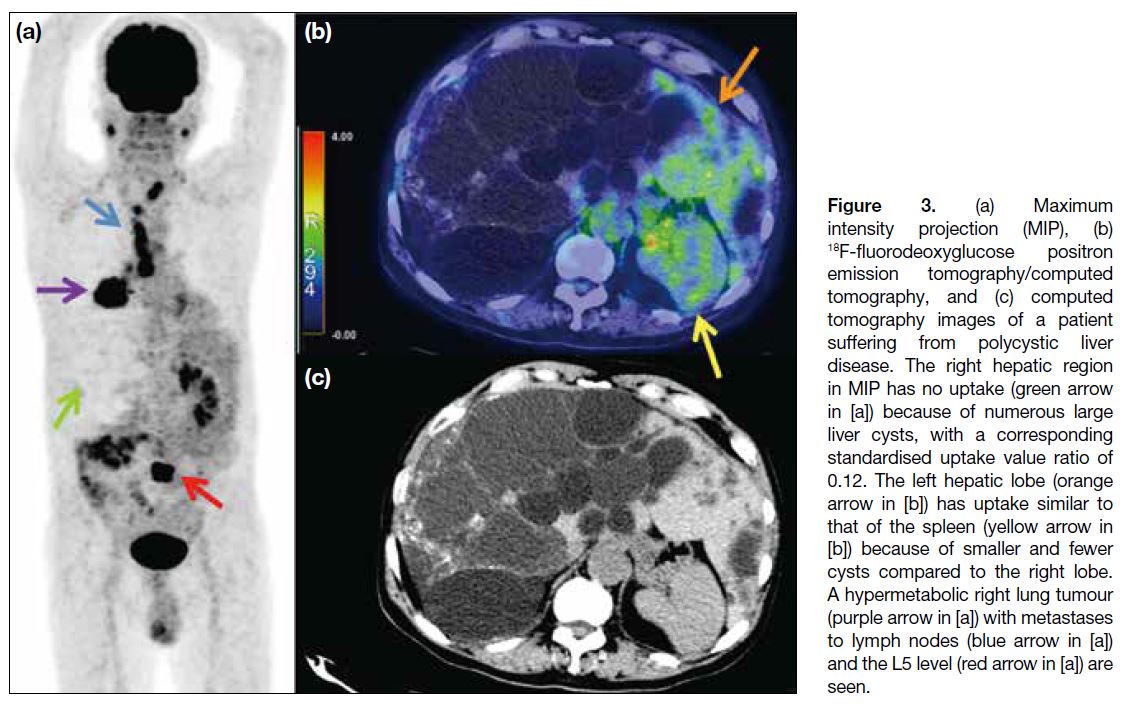
uptake. Figure 3 shows another subject who had larger
and more cysts compared with Figure 1e. The MIP and
hybrid images in Figure 3 demonstrate almost no uptake
in the right lobe of the liver and the corresponding SUV ratio was 0.12, while the left lobe of the liver (orange
arrow in Figure 3b), with fewer and smaller cysts,
demonstrated uptake similar to that of the blood pool
and the spleen (yellow arrow in Figure 3b). Although
the right hepatic lobe is commonly recommended as
the standard metabolic reference in many international
guidelines,[3] [4] [5] [6] Figure 3 clearly illustrates that the right
lobe is less appropriate for reference compared with the
left lobe when the right lobe is more diseased.
Figure 3. (a) Maximum
intensity projection (MIP), (b) 18F-fluorodeoxyglucose positron emission tomography/computed tomography, and (c) computed tomography images of a patient suffering from polycystic liver disease. The right hepatic region in MIP has no uptake (green arrow in [a]) because of numerous large liver cysts, with a corresponding standardised uptake value ratio of 0.12. The left hepatic lobe (orange arrow in [b]) has uptake similar to that of the spleen (yellow arrow in [b]) because of smaller and fewer cysts compared to the right lobe. A hypermetabolic right lung tumour (purple arrow in [a]) with metastases to lymph nodes (blue arrow in [a]) and the L5 level (red arrow in [a]) are seen.
DISCUSSION
18F-FDG visual interpretation is advocated for oncological[3] [4] [5] [13] [14] [15] and inflammatory[6] [14] conditions, using
liver and blood pool as metabolic references. While
the PERCIST 1.0 criteria recommend that diseased
liver is generally unsuitable for visual reference, the
precise effects of different hepatic diseases on 18F-FDG
uptake have not been entirely elucidated.[4] The current
study included a spectrum of liver diseases ranging
from biochemical abnormality (hyperbilirubinaemia)
to various structural changes (cirrhosis, steatosis, and
polycystic liver disease) that can either increase or
decrease the SUV ratio. They can be ranked in terms
of their mean SUV ratios in descending order of
hyperbilirubinaemia, control, cirrhosis and steatosis, and polycystic liver disease.
The hyperbilirubinaemia cases showed higher SUV
ratios than the controls. This is likely because jaundice
implies hepatitis, and inflammation generally leads
to increased 18F-FDG uptake.[15] This hypothesis is
supported by our findings that higher serum bilirubin
levels were associated with higher SUV ratios (Figure 2). High SUV ratio raises the concern for increasing false
negative rate in lesion delineation, particularly if the
lesion is only mildly 18F-FDG–avid. Clinical scenarios
of hyperbilirubinaemia, due to biliary obstruction or
acute hepatitis, are commonly encountered in oncology
practice. In this study, hyperbilirubinaemia was used as
an indicator of abnormal liver function and hepatitis.
While serum bilirubin can be hepatic or haemolytic in
origin, 89.7% of the hyperbilirubinaemia cases in this
study exhibited elevated levels of other liver enzyme(s).
This finding supports the hypothesis that the observed
hyperbilirubinaemia was primarily hepatic in nature.
The cirrhosis cases had lower mean SUV ratios
compared with the controls, probably as a result of the
impaired glucose metabolism in liver fibrosis. Although
liver biopsy is the gold standard for the diagnosis of
cirrhosis, the procedure is invasive and not commonly
employed. The cirrhosis subjects in this study were
therefore selected based on radiological and endoscopic
findings. For radiological findings, the sensitivity varies
from 77% to 82% and the specificity ranges from 68%
to 80%.[16] In this study, most cirrhotic cases (85.2%) had
identifiable aetiologies of the cirrhosis. The majority
(59.3%) also had cirrhotic features documented in more
than one investigation.
The steatosis cases had lower SUV ratios than the
control cases, consistent with previous observations.[17]
We demonstrated that a more significant reduction in the
SUV ratio can be expected in livers with higher degrees
of steatosis. These results can be explained by the lower
18F-FDG uptake in fat content compared with normal
liver parenchyma and the impaired glucose metabolism
in steatosis. Abele and Fung’s study[18] showed that the
SUVmean in steatotic patients was lower than that of the
controls (2.18 vs. 2.03). While this difference did not
achieve statistical significance, the authors suggested
that the limited power of their study might not have been
sufficient to detect a true difference between the cases
(i.e., type II error). The different sample sizes between
Abele and Fung’s study (n = 23)[18] and the current report
(n = 52) may offer an explanation of this discrepancy. On the other hand, Keramida et al[19] demonstrated no
difference in SUVmean between steatosis cases and the
controls; however, their SUVmean had a complicated
adjustment for hepatic fat content and the potential effect
of such adjustment on the original SUV magnitude is still
unclear. Most clinical scenarios and research studies,
including our investigation, had no adjustment. The
current study excluded any subject with biochemical or
structural abnormality of steatotic livers, while previous
studies did not specifically elaborate the biochemical or
structural properties.[17] [18] [19] Most importantly, the current
study emphasises the SUVliver/SUVblood pool ratio instead of absolute SUV, because the ratio is more relevant to
visual interpretation.
A simple cyst is defined as a thin-walled sac containing serous fluid.[20] Therefore, it has lower 18F-FDG uptake
compared with normal hepatic parenchyma. This
explains why the mean SUV ratio observed in polycystic
liver cases was the lowest among all the cases. While
polycystic liver is not considered a reliable metabolic
reference, its SUV was still evaluated in a 3-cm–diameter fixed-sized spherical VOI in accordance with
the PERCIST 1.0 criteria for equivalent comparison
with other cases.[4] [5] The minimum SUV ratio among
the polycystic liver cases was 0.12, which is clearly
unsuitable as metabolic reference (Figure 3). This
report further demonstrates that the hepatic uptake in
polycystic liver disease depends on the size, number, and
distribution of the cysts. The heterogeneous and variable
uptake in the polycystic liver prohibits its application as
a reliable metabolic reference.
Steatosis, cirrhosis and polycystic liver disease cases
showed lower SUV ratios than those in the control cases.
Their hepatic uptake could be similar to or even lower
than blood pool or splenic uptake. This observation was
distinct from the observation in the controls, in which
normal liver uptake was always greater than blood pool
and splenic uptake. A previous study of high-grade
lymphoma indeed has suggested that lymphomatous
involvement in spleen should be suspected if the spleen
has greater uptake than the liver.[21] Therefore, the
deceptively low liver-to–blood pool SUV ratio observed
in steatosis, cirrhosis, and polycystic liver disease can
potentially lead to higher false positive rates in lesion
detection.
All disease cases had mean SUV ratios different from the controls and the differences were statistically significant
in two-sided t tests. However, such quantitative differences may not always appear conspicuous in the
qualitative visual interpretation. For example, the visual
contrast between liver/blood pool uptake in the cirrhosis
cases was slightly less than that in the control cases. The
visual differences between the mild hyperbilirubinaemia/steatosis cases and the controls were also subtle. On
the other hand, in severe hyperbilirubinaemia, severe
steatosis and polycystic liver disease cases, their visual
contrast between liver/blood pool uptake was obviously
different from that in the controls. Thus, severe liver
diseases can have significant quantitative and qualitative
effects on the liver/blood pool references. This can
eventually affect the diagnostic accuracy of visual
interpretation.
Limitations
The current study had some limitations. First, subtle
hepatic tumour or metastasis may be present. To
minimise this pitfall, subjects with a histological
diagnosis or radiological suspicion of liver malignancy
were excluded from this study. Second, the number of
cases of polycystic liver disease (10 patients) was lower
compared to other groups because of its inherently low
prevalence. Third, the liver function tests were obtained
within 2 weeks, rather than on the same day, of 18F-FDG
PET/CT acquisition. Fourth, this study demonstrated
that all disease cases had SUV ratios different from that
of the controls in quantitative aspect. Future study is
required to determine if this quantitative difference can
be translated to significant changes in qualitative visual
interpretation.
CONCLUSION
Liver/blood pool uptake in 18F-FDG PET/CT can be influenced by various liver conditions, including
hyperbilirubinaemia, cirrhosis, steatosis, and polycystic
liver disease. As liver diseases progress in severity,
their impact on liver/blood pool uptake becomes more
prominent. Therefore, radiologists should exercise great
caution in the utilisation of liver/blood pool uptake as
metabolic references in cases of significant hepatic
disease. Clinical history, biochemical function and
imaging findings should be thoroughly reviewed before
visual interpretation.
REFERENCES
1. Ziai P, Hayeri MR, Salei A, Salavati A, Houshmand S, Alavi A,
et al. Role of optimal quantification of FDG PET imaging in the
clinical practice of radiology. Radiographics. 2016;36:481-96. Crossref
2. Boellaard R. Standards for PET image acquisition and quantitative
data analysis. J Nucl Med. 2009;50 Suppl 1:11S-20S. Crossref
3. Barrington SF, Mikhaeel NG, Kostakoglu L, Meignan M,
Hutchings M, Müeller SP, et al. Role of imaging in the staging and
response assessment of lymphoma: consensus of the International
Conference on Malignant Lymphomas Imaging Working Group.
J Clin Oncol. 2014;32:3048-58. Crossref
4. Wahl RL, Jacene H, Kasamon Y, Lodge MA. From RECIST to
PERCIST: evolving considerations for PET response criteria in
solid tumors. J Nucl Med. 2009;50 Suppl 1:122S-50S. Crossref
5. O JH, Lodge MA, Wahl RL. Practical PERCIST: a simplified
guide to PET Response Criteria in Solid Tumors 1.0. Radiology.
2016;280:576-84. Crossref
6. Jamar F, Buscombe J, Chiti A, Christian PE, Delbeke D,
Donohoe KJ, et al. EANM/SNMMI guideline for 18F-FDG use in
inflammation and infection. J Nucl Med. 2013;54:647-58. Crossref
7. Boellaard R, O’Doherty MJ, Weber WA, Mottaghy FM,
Lonsdale MN, Stroobants SG, et al. FDG PET and PET/CT: EANM
procedure guidelines for tumour PET imaging: version 1.0. Eur J
Nucl Med Mol Imaging. 2010;37:181-200. Crossref
8. Park JW, Kim JH, Kim SK, Kang KW, Park KW, Choi JI, et al.
A prospective evaluation of 18F-FDG and 11C-acetate PET/CT for
detection of primary and metastatic hepatocellular carcinoma. J
Nucl Med. 2008;49:1912-21. Crossref
9. Gevers TJ, Drenth JP. Diagnosis and management of polycystic liver disease. Nat Rev Gastroenterol Hepatol. 2013;10:101-8. Crossref
10. Nabi HA, Zubeldia JM. Clinical applications of 18F-FDG in oncology. J Nucl Med Technol. 2002;30:3-9.
11. US Department of Health and Human Services. Common
Terminology Criteria for Adverse Events (CTCAE) version 5.0.
2017. Available from: https://ctep.cancer.gov/protocoldevelopment/electronic_applications/docs/ctcae_v5_quick_reference_5x7.pdf. Accessed 9 Oct 2023.
12. Jacobs JE, Birnbaum B, Shapiro MA, Langlotz CP, Slosman F, Rubesin SE, et al. Diagnostic criteria for fatty infiltration of the liver on contrast-enhanced helical CT. AJR Am J Roentgenol. 1998;171:659-64. Crossref
13. Barrington SF, Kluge R. FDG PET for therapy monitoring in
Hodgkin and non-Hodgkin lymphomas. Eur J Nucl Med Mol
Imaging. 2017;44:97-110. Crossref
14. Soussan M, Nicolas P, Schramm C, Katsahian S, Pop G, Fain O,
et al. Management of large-vessel vasculitis with FDG-PET:
a systematic literature review and meta-analysis. Medicine
(Baltimore). 2015;94:e622. Crossref
15. Love C, Tomas MB, Tronco GG, Palestro CJ. FDG PET of infection and inflammation. Radiographics. 2005;25:1357-68. Crossref
16. Kudo M, Zheng RQ, Kim SR, Okabe Y, Osaki Y, Iijima H, et al. Diagnostic accuracy of imaging for liver cirrhosis compared to histologically proven liver cirrhosis. A multicenter collaborative study. Intervirology. 2008;51 Suppl 1:17-26. Crossref
17. Lin CY, Lin WY, Lin CC, Shih CM, Jeng LB, Kao CH. The
negative impact of fatty liver on maximum standard uptake value
of liver on FDG PET. Clin Imaging. 2011;35:437-41. Crossref
18. Abele JT, Fung CI. Effect of hepatic steatosis on liver FDG
uptake measured in mean standard uptake values. Radiology.
2010;254:917-24. Crossref
19. Keramida G, Potts J, Bush J, Verma S, Dizdarevic S, Peters AM.
Accumulation of 18F-FDG in the liver in hepatic steatosis. AJR
Am J Roentgenol. 2014;203:643-8. Crossref
20. Vachha B, Sun MR, Siewert B, Eisenberg RL. Cystic lesions of the liver. AJR Am J Roentgenol. 2011;196:W355-66. Crossref
21. Rini JN, Leonidas JC, Tomas MB, Palestro CJ. 18F-FDG PET versus
CT for evaluating the spleen during initial staging of lymphoma. J
Nucl Med. 2003;44:1072-4.