
Normative Measurements of Orbital Structures in the Hong Kong Population
ORIGINAL ARTICLE
Normative Measurements of Orbital Structures in the Hong Kong Population
TY Ko, JHM Cheng, YS Luk, JLS Khoo
Department of Radiology, Pamela Youde Nethersole Eastern Hospital, Hong Kong
Correspondence: Dr TY Ko, Department of Radiology, Pamela Youde Nethersole Eastern Hospital, Hong Kong. Email: benkty@gmail.com
Submitted: 27 Jun 2019; Accepted: 30 Sep 2019.
Contributors: All authors designed the study. YSL, JHMC and TYK acquired the data. JHMC and TYK analysed the data. TYK drafted the
manuscript. All authors critically revised the manuscript for important intellectual content. All authors had full access to the data, contributed to
the study, approved the final version for publication, and take responsibility for its accuracy and integrity.
Conflicts of Interest: The authors have no conflicts of interest to disclose.
Funding/Support: This research received no specific grant from any funding agency in the public, commercial, or not-for-profit sectors.
Ethics Approval: This study has been approved by the Hong Kong East Cluster Research Ethics Committee (Ref HKECREC-2019-035). The
requirement for patient consent was waived.
Abstract
Objective
We sought to establish normative measurements of orbital structures in the Hong Kong population using
computed tomography (CT), and to evaluate for differences according to sex and age.
Methods
CT paranasal sinus examinations were retrospectively reviewed. Differences according to sex and age
were analysed using Student’s t test and Pearson’s correlation, respectively.
Results
Data of 256 patients (F:M=141:115, age range, 21-91 years) were included. Normal measurements of the
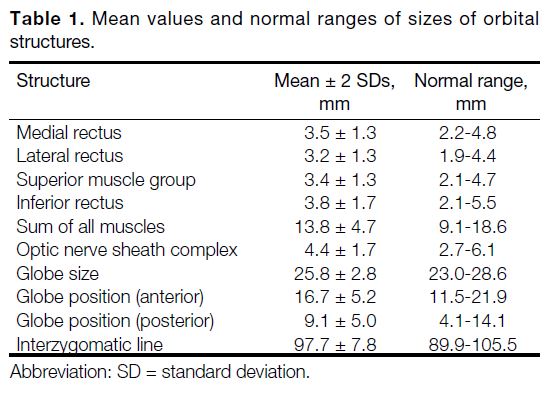
diameters of the extraocular muscles (EOMs) [mean ± 2 standard deviations] were: medial rectus 3.5 ± 1.3 mm;
lateral rectus 3.2 ± 1.3 mm; superior rectus and levator palpebrae superioris (superior muscle group) 3.4 ± 1.3 mm;
and inferior rectus 3.8 ± 1.7 mm. The normal ranges for other orbital structures were as follows: globe diameter
25.8 ± 2.8 mm; optic nerve diameter 4.4 ± 1.7 mm; and interzygomatic line 97.7 ± 7.8 mm. The normal position of the
globe was 16.7 ± 5.2 mm. Sex differences were noted in the means of EOM thickness, globe size, interzygomatic lines
(p = 0.0002, p = 0.0002, p < 0.0001 respectively), and anterior globe position (p = 0.0045). A positive correlation
was found between age and the sum of the mean diameters of the EOMs (r = 0.17, p = 0.0072).
Conclusion
Our results may help radiologists and clinicians to interpret CT scans of Hong Kong patients with
suspected EOM enlargement, proptosis, or other changes in orbital morphology more quantitatively.
Key Words: Anatomy; Asian continental ancestry group; Exophthalmos; Extraocular muscles; Orbit
中文摘要
香港人口眼眶結構的正常尺徑
高子恩、鄭希敏、陸嬈、邱麗珊
目的
我們試圖建立使用電腦掃描(CT)對香港人口的眼眶結構進行規範測量,並評估其性別和年齡差異。
方法
回顧分析CT鼻旁竇檢查,分別使用Student’s t 檢驗和Pearson相關係數分析按性別和年齡劃分的差異。
結果
納入256例患者的資料(女性:男性 = 141:115,年齡介乎21-91歲)。眼外肌(EOM)直
徑的正常測量值(平均值±2標準偏差)包括:內直肌3.5±1.3 mm、側直肌3.2±1.3 mm、上直肌
和上瞼提肌(上肌群)3.4±1.3 mm、下直肌3.8±1.7 mm。其他眼眶結構的正常範圍如下:球形
直徑25.8±2.8 mm、視神經直徑4.4±1.7 mm、雙眼顴間隙線為97.7±7.8 mm。眼球的正常位置
為16.7±5.2 mm。EOM的厚度、球體大小、雙眼顴間隙線和前眼球位置呈性別差異(分別為
p = 0.0002、p = 0.0002、p < 0.0001和p = 0.0045)。年齡與EOMs的平均直徑總和呈正相關(r = 0.17,
p = 0.0072)。
結論
研究結果可有助於放射科醫生和臨床醫生更定量地解釋疑似香港患者EOM增大、眼底突出或其他眼眶形態改變的CT報告。
INTRODUCTION
Many disease entities affect the thickness of the
extraocular muscles (EOMs), as well as the position
of the globe, with Grave’s ophthalmopathy one of the
commonest examples to affect both as part of its disease
process.[1] It is therefore important to establish normative
values for the orbital structures of concern in order to
detect abnormal findings on imaging. Studies have
shown differences in normal values in populations of
different ethnicities.[2] [3] No comprehensive normative
measurements for orbital structures have been published
regarding the Hong Kong Chinese population, hence the
conception of this study. Different imaging modalities are
available for the measurement of the orbital structures,
including computed tomography (CT), magnetic
resonance imaging, and ultrasound.[4] Despite the
superiority of magnetic resonance imaging in evaluating
soft tissue such as EOMs, CT remains the more readily
available modality in Hong Kong, therefore was the
modality of choice in this study. The aim of the present
study was to establish normative measurements of orbital
structures in the Hong Kong Chinese population using
CT, and to evaluate any sex- or age-related differences.
METHODS
The imaging data from a total of 289 consecutive patients
referred to the authors’ department for CT scans of the
paranasal sinuses (with or without intravenous contrast)
during the period February 2016 to February 2018 were
retrospectively reviewed. Only Hong Kong Chinese
patients were included; other ethnicities were excluded.
Cases of hyperthyroidism, known orbital abnormalities,
and studies with significant imaging artefacts were
excluded.
The examinations were performed with two CT
scanners, Toshiba Aquilion 64 (Toshiba Medical,
Tochigi, Japan) and Siemens Somatom AS+ (Siemens
Healthcare, Erlangen, Germany). Acquisitions consisted
of 0.5-mm axial sections with or without intravenous
contrast administration. The EOMs and the optic
nerve sheath complexes were measured perpendicular
to the orbital wall in the coronal plane. The axial and
sagittal axes were aligned along the ipsilateral optic
nerve, and the maximum diameters were measured on
coronal reconstructions (Figure 1). The superior rectus
and the levator palpebrae were measured together as
a single superior muscle group, as the two were not
readily distinguishable at their maximal thicknesses. The
superior muscle group and inferior rectus muscle were
measured vertically, whereas the medial rectus muscle,
lateral rectus muscle, and optic nerve sheath complex
were measured horizontally.
Figure 1. (a) Selected images of the right orbit. The extraocular
muscles were measured on coronal view with the axial and
sagittal axes aligned along the ipsilateral optic nerve. (b) Selected
magnified image of the right orbit. The extraocular muscles were
measured on coronal view with the axial and sagittal axes aligned
along the ipsilateral optic nerve.

For the measurements of the interzygomatic line, globe
sizes, and globe positions, the superior-inferior axis was
aligned along the falx cerebri in the coronal plane, along
the anterior-posterior axis formed by the crista galli in
the axial plane, and along the optic nerve in the sagittal
plane.[5] Measurements of these structures were then
done in the axial plane. The interzygomatic distance
was measured at the level of lenses. The globe size
was measured as the maximal diameter perpendicular
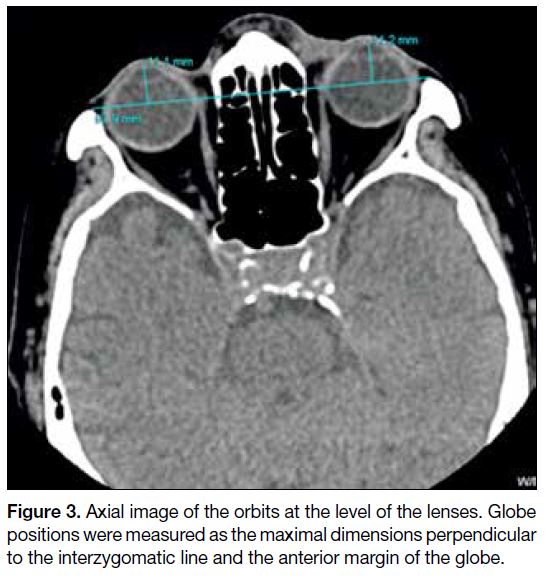
to the interzygomatic line. The globe positions were
measured as the maximal dimensions perpendicular to
the interzygomatic line and the anterior margin of the
globe (Figures 2 and 3). All images were viewed under
constant window and level settings of width 300 HU and
level 40 HU during the measurements, to prevent slight variation of the measurements with change in window
settings.
Figure 2. Axial image of the orbits at the level of the lenses. The
interzygomatic line was measured as the distance between the two
zygomas at the level of the lenses. The globe sizes were measured
as the maximal dimensions perpendicular to the interzygomatic
line.
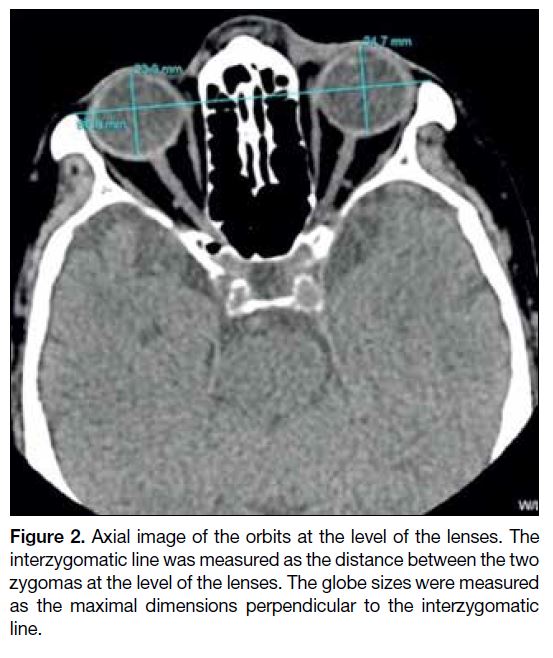
Figure 3. Axial image of the orbits at the level of the lenses. Globe
positions were measured as the maximal dimensions perpendicular
to the interzygomatic line and the anterior margin of the globe.
Statistical Analysis
The corresponding dimensions of the left and right orbits
were averaged for each patient for further analysis. The
superior muscle group, and lateral, medial and inferior
rectus muscles were added together to provide a sum of all the EOMs in each patient. Ninety-five percent normal
cut-off values were obtained by adding and subtracting
two standard deviations from the mean. The independent
t test was used to compare data between men and women. Pearson’s correlation was used to analyse the
relationship between age and the orbital structures. A
p value of <0.05 was considered statistically significant.
RESULTS
A total of 256 cases with 512 normal orbits were included
(115 men and 141 women). The patients were aged 21
to 91 years (mean age, 58.2 years). The mean measured
diameters of the rectus muscles were 3.5 mm, 3.2 mm,
3.4 mm, and 3.8 mm in the medial, lateral, superior group,
and inferior rectus muscles, respectively (Table 1).
Table 1. Mean values and normal ranges of sizes of orbital structures./div>
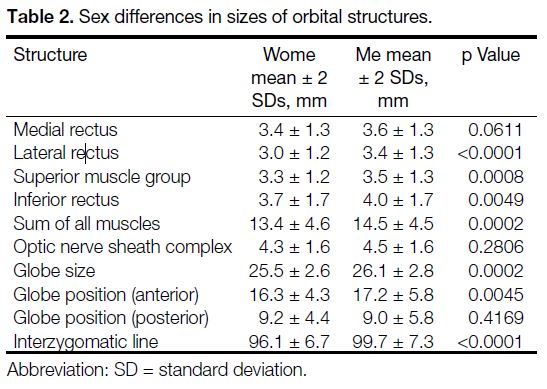
The EOMs were found to be thicker in men than in
women (p = 0.0002) [Table 2]. With the exception
of the medial rectus muscle, all measurements were
significantly different between men and women (all
p < 0.05). The globe sizes and interzygomatic line
distances were larger in men than in women (p = 0.0002
and p < 0.0001 respectively). The globe position values
were also larger in men (p = 0.0045), meaning that the
globes were more anteriorly positioned in men than in women. No significant difference was noted between the
measurements of optic nerve sheath complexes in men
and those in women (p = 0.2806).
Table 2. Sex differences in sizes of orbital structures.
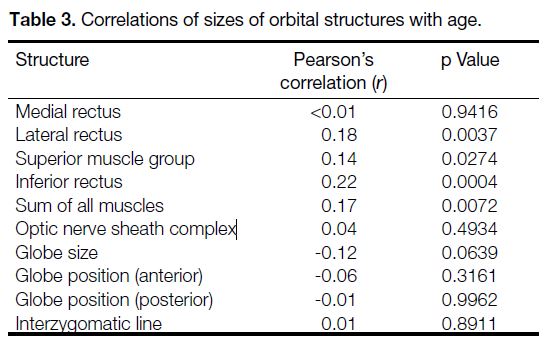
No consistent correlation with age was found in any of
the individual measured structures (Table 3). Comparing
age with the sum of all EOMs, a significant positive
correlation was noted (r = 0.17, p = 0.0072).
Table 3. Correlations of sizes of orbital structures with age.
DISCUSSION
The EOMs are long fusiform structures that stretch from
the orbital apex to the globe. Enlargement of the EOMs is
observed in multiple disease entities, including Grave’s
ophthalmopathy, primary and metastatic neoplasms,
inflammatory conditions, and trauma.
Varying the window settings has an impact on the
measurements of EOMs.[6] In the present study, a standard
‘soft tissue’ window of width 300 HU and level 40 HU
was used in accordance with the routine practice of the
authors’ centre.
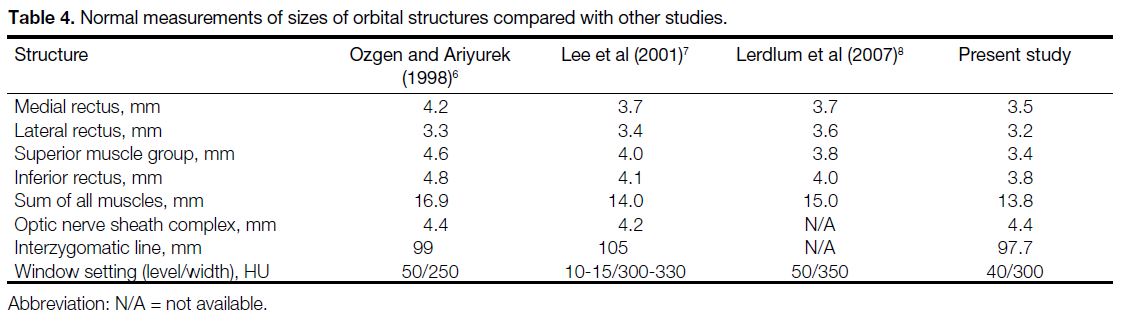
Compared with other studies conducted in Asia
(Turkey[6], Korea[7], and Thailand[8]), the mean measured
diameters of the rectus muscles in the present study
were slightly thinner for all of the individual muscles
(Table 4). Such differences could be due to underlying
genetic, socioeconomic, and nutritional factors. Some of
the studies also measured the EOMs in the axial plane
instead of the coronal plane as in this study. Differences
in window settings may have also contributed. Caution
must therefore be maintained regarding window settings
when referring to the measurements of the current study
in clinical practice.
Table 4. Normal measurements of sizes of orbital structures compared with other studies.
In the present study, men were found to have significantly
larger globe sizes, interzygomatic line distances, and sums of EOM thickness. This result is in accordance
with other similar studies. In another study, however,[5]
it was noted that the ratio of the interzygomatic line
distance to the diameters of the EOMs showed no
statistically significant difference between women and
men. It was therefore proposed that differences between
the diameters of EOMs depend on head size rather than
sex.
One of the focuses of the current study was to determine
the normative value of the globe position as an aid in
determining the presence or absence of proptosis. It is
known that the normal values of globe positions vary
with ethnicity.[2] [3] With the difference in terms of facial
structure such as deeper eye sockets in Caucasians,
normative measurements of globe positions in Western
populations may not be directly applicable to the Hong
Kong population. Two common options to gauge the
globe position are to measure the distances between
the anterior or posterior margins of the globe and the
length of the interzygomatic line.[5] [7] [8] [9] We have chosen to
measure the distances between the anterior margins of
the globe for the following reasons. First, the distance
from the anterior margin is often longer than the distance
between the posterior margins, resulting in a lower
margin of error in measurements. Second, abnormalities
such as staphyloma more often affect the posterior
margin of the globe, which may reduce the accuracy of
measurements. The commonly quoted figures for the
definition of proptosis from Western sources are >21
to 23 mm anterior to the interzygomatic line.[10] [11] [12] In the
present study, the upper limit of the normal range was
21.9 mm, which falls within the range for proptosis. This
could be due to factors other than facial structure affecting
the measurement, for example the high prevalence of
myopia in the Asian population, which affects the shape
of the globe.[13] [14]
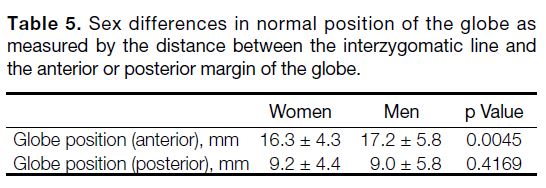
In our findings, men had more anteriorly positioned
globes compared with women (p = 0.0045). The normal
range for men was 17.2 ± 5.8 mm; for women it was
16.3 ± 4.3 mm. Studies that measure degrees of proptosis
using exophthalmometry have shown conflicting results,
with some showing sex differences and other showing
none.[2] [15] Other studies using CT to measure the position
as the distance between the interzygomatic lines and the
posterior margins of the globe noted no significant sex
differences.[5] [7] For a more direct comparison, we have
converted our measurements by subtracting the distance
between the interzygomatic lines and the anterior
margins of the globe from the globe size in individual
orbits (Table 5, Figures 2 and 3). When measuring the
globe position in this way, our findings also showed
no significant difference between women and men
(p = 0.4169), suggesting that larger globe sizes in men
most likely contribute to the more anterior globe margins
in men than in women.
Table 5. Sex differences in normal position of the globe as
measured by the distance between the interzygomatic line and
the anterior or posterior margin of the globe.
Previous studies have shown a tendency for the EOMs
to slightly enlarge with age,[5] [7] but the differences did not
attain statistical significance. The same observation was
made in the current study, with most individual EOMs
showing positive weak correlation (r < 0.2). Furthermore,
no correlation was found between age and globe position
(r = –0.06).
The limitation of our study is that the data were collected
retrospectively, and the eye movement/gaze could not
be standardised. It is noted that eye movements during
imaging may affect the diameters of the EOMs, with
some studies asking the patient to maintain a forward
gaze and gentle eye closure during scanning. However,
this effect was minimised in our study with a mixture
of various gazes and a considerable population size.
In addition, we believe that including cases with some
side gaze is important in establishing normative values,
since it may not be always possible to obtain a primary
gaze in daily practice (eg, in patients with inability to
comprehend or cooperate).
In conclusion, the normative measurements of orbital
structures established in our study of the Hong Kong
Chinese population may help radiologists and clinicians
to quantitatively interpret CT scans of patients with
suspected EOM enlargement, proptosis, or other changes
in the orbital morphology.
REFERENCES
1. Nugent RA, Belkin RI, Neigel JM, Rootman J, Robertson WD,
Spinelli J, et al. Graves orbitopathy: correlation of CT and clinical
findings. Radiology. 1990;177:675-82. Crossref
2. Migliori ME, Gladstone GJ. Determination of the normal range
of exophthalmometric values for black and white adults. Am J
Ophthalmol. 1984;98:438-42. Crossref
3. de Juan E Jr, Hurley DP, Sapira JD. Racial differences in normal
values of proptosis. Arch Intern Med. 1980;140:1230-1. Crossref
4. Sohn MJ, Lee HK, Lee SS, Kim JH, Choi CG, Suh DC, et al.
Ultrasonic measurement of the extraocular muscles: a comparison
with CT. J Korean Radiol Soc. 2000;42:31-5. Crossref
5. Patrinely JR, Osborn AG, Anderson RL, Whiting AS. Computed
tomographic features of nonthyroid extraocular muscle enlargement.
Ophthalmology. 1989;96:1038-47. Crossref
6. Ozgen A, Ariyurek M. Normative measurements of orbital
structures using CT. AJR Am J Roentgenol. 1998;170:1093-6. Crossref
7. Lee JS, Lim DW, Lee SH, Oum BS, Kim HJ, Lee HJ. Normative
measurements of Korean orbital structures revealed by computerized
tomography. Acta Ophthalmol Scand. 2001;79:197-200. Crossref
8. Lerdlum S, Boonsirikamchai P, Setsakol E. Normal measurements
of extraocular muscle using computed tomography. J Med Assoc
Thai. 2007;90:307-12.
9. Ramli N, Kala S, Samsudin A, Rahmat K, Abidin ZZ. Proptosis —
Correlation and agreement between Hertel exophthalmometry and
computed tomography. Orbit. 2015;34:257-62. Crossref
10. Haaga JR, Boll DT, editors. CT and MRI of the whole body. 6th
ed. Philadelphia: Elsevier; 2017.
11. Epstein O, Perkin GD, Cookson J, Watt IS, Rakhit R, Robins A,
editors. Pocket guide to clinical examination. 4th ed. Philadelphia
(PA): Mosby Elsevier; 2008. Crossref
12. Dähnhert W. Radiology review manual. 7th ed. Philadelphia (PA):
Lippincott Williams & Wilkins; 2011.
13. Benjamin WJ. Borish’s clinical refraction. Philadelphia (PA):
Elsevier; 1998: p 30-46.
14. Blake CR, Lai WW, Edward DP. Racial and ethnic differences in
ocular anatomy. Int Ophthalmol Clin. 2003;43:9-25. Crossref
15. Karti O, Selver OB, Karahan E, Zengin MO, Uyar M. The effect of
age, gender, refractive status and axial length on the measurements
of Hertel exophthalmometry. Open Ophthalmol J. 2015;9:113-5. Crossref
| Attachment | Size |
|---|---|
| v24n1_Normative.pdf | 535.43 KB |