Imaging Spectrum of Sellar and Parasellar Masses in a Paediatric Population: a Pictorial Essay
PICTORIAL ESSAY
Imaging Spectrum of Sellar and Parasellar Masses in a Paediatric Population: a Pictorial Essay
S Gupta, S Singh, R Dixit, A Prakash
Department of Radiology, Maulana Azad Medical College, India
Correspondence: Dr S Gupta, Department of Radiology, Maulana Azad Medical College, India. Email: surabhig27@gmail.com
Submitted: 8 Apr 2020; Accepted: 24 Aug 2020.
Contributors: All authors designed the study, acquired the data, analysed the data, drafted the manuscript, and critically revised the manuscript
for important intellectual content. All authors had full access to the data, contributed to the study, approved the final version for publication, and
take responsibility for its accuracy and integrity.
Conflicts of Interest: The authors declare no conflicts of interest.
Funding/Support: This pictorial essay received no specific grant from any funding agency in the public, commercial or not-for-profit sectors.
Ethics Approval: Ethical approval was requested and obtained from the institutional ethics committee. Patient consent was obtained in each case.
INTRODUCTION
Tumours in the sellar and suprasellar regions are not
uncommon in the paediatric population and differ to
adult sellar tumours with respect to type and frequency.
Such masses comprise about 10% of all paediatric
brain tumours.[1] Magnetic resonance imaging (MRI)
renders high intrinsic soft tissue contrast and greater
anatomic detail. It remains the mainstay in diagnosis and
characterisation of these lesions. Computed tomography
may provide complimentary information, especially in
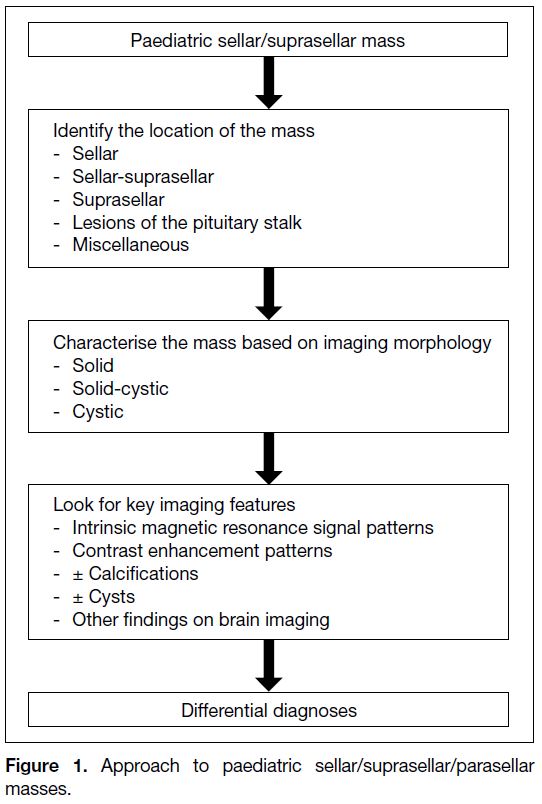
identifying the presence of calcifications. The first step
in diagnosing these lesions is to determine their anatomic
location, followed by an assessment of their intrinsic
signal and enhancement pattern. Cystic component / calcification also needs to be looked at as it aids
characterisation of the lesions (Figure 1). The clinical
symptoms and hormonal profile along with the age of
the child are also important to narrow down the list of
differential diagnoses. Clinical symptoms can be non-specific
due to raised intracranial pressure or specifically
related to hormonal derangement. Altered vision may
occur secondary to mass effect on the optic apparatus.[1] [2]
Figure 1. Approach to paediatric sellar/suprasellar/parasellar masses.
NORMAL ANATOMY
The sellar, suprasellar, and parasellar regions are an
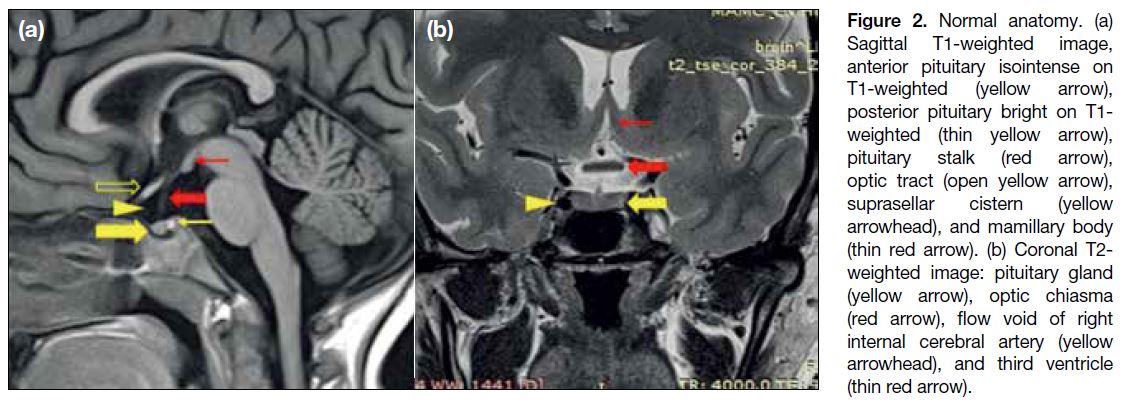
anatomically complex area (Figure 2). The pituitary fossa is a spherical depression in the sphenoid bone,
bounded by the sphenoid sinus antero-inferiorly, the
cavernous sinuses laterally, diaphragm sellae and the
hypothalamus superiorly, and dorsum sellae and the
brainstem posteriorly. The suprasellar cistern is an
expansion of the subarachnoid space and contains
the optic nerves, chiasma, tracts, Circle of Willis, and
pituitary stalk / infundibulum. The hypothalamus forms
the floor and lateral walls of the third ventricle. The tuber
cinereum is a ridge of tissue between the infundibulum
and mammillary bodies. The pituitary gland is composed
of two parts: the adenophysis, isointense to brain on both
T1-weighted (T1W) and T2-weighted (T2W) images
and the neurohypophysis, seen as a bright spot on T1W
images. The anterior lobe appears hyperintense like the
posterior lobe in newborns and becomes T1 isointense
by 6 to 8 weeks of life.[3]
Figure 2. Normal anatomy. (a)
Sagittal T1-weighted image, anterior pituitary isointense on T1-weighted (yellow arrow), posterior pituitary bright on T1-weighted (thin yellow arrow), pituitary stalk (red arrow), optic tract (open yellow arrow), suprasellar cistern (yellow arrowhead), and mamillary body (thin red arrow). (b) Coronal T2-weighted image: pituitary gland (yellow arrow), optic chiasma (red arrow), flow void of right internal cerebral artery (yellow arrowhead), and third ventricle (thin red arrow).
Craniopharyngiomas are the most common paediatric
intracranial tumours of non-glial origin, accounting
for up to 10% of paediatric brain tumours[4] and 50% of
paediatric suprasellar tumours.[5] Histologically, there
are two subtypes: the adamantinomatous type that has a
bimodal distribution and is mostly seen in children, and
the squamous papillary type that is seen mostly in adults
(Table 1). Craniopharyngiomas are most commonly both
intrasellar and suprasellar (53-75%), followed by purely
suprasellar (20-41%) and, rarely, purely intrasellar.[6]
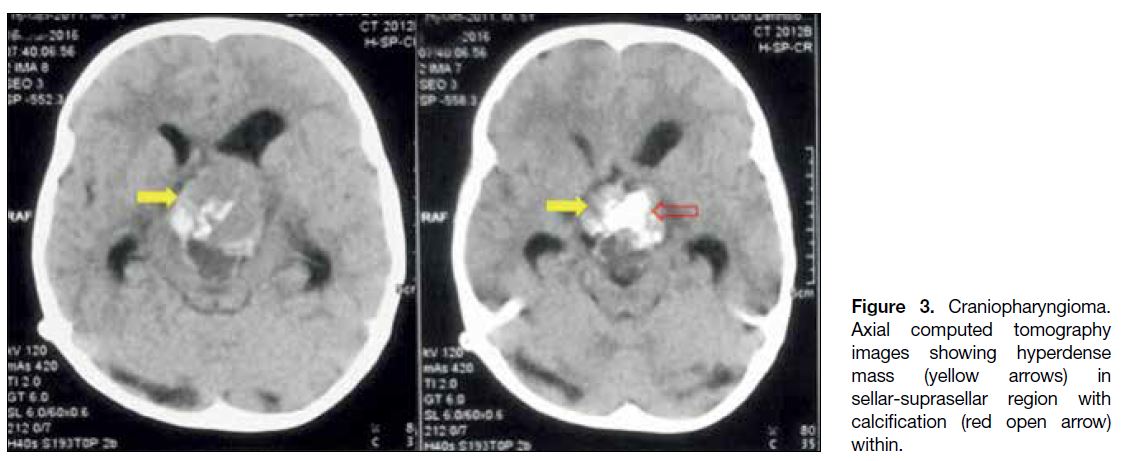
Computed tomography scan is useful for detecting
calcifications that may present in up to 87% of the cases
(Figure 3).
Table 1. Adamantinomatous versus papillary craniopharyngioma.
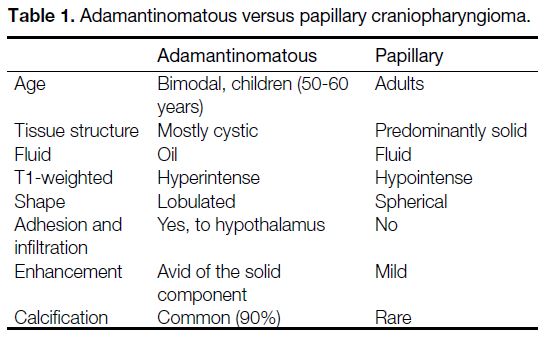
Figure 3. Craniopharyngioma.
Axial computed tomography images showing hyperdense mass (yellow arrows) in sellar-suprasellar region with calcification (red open arrow) within.
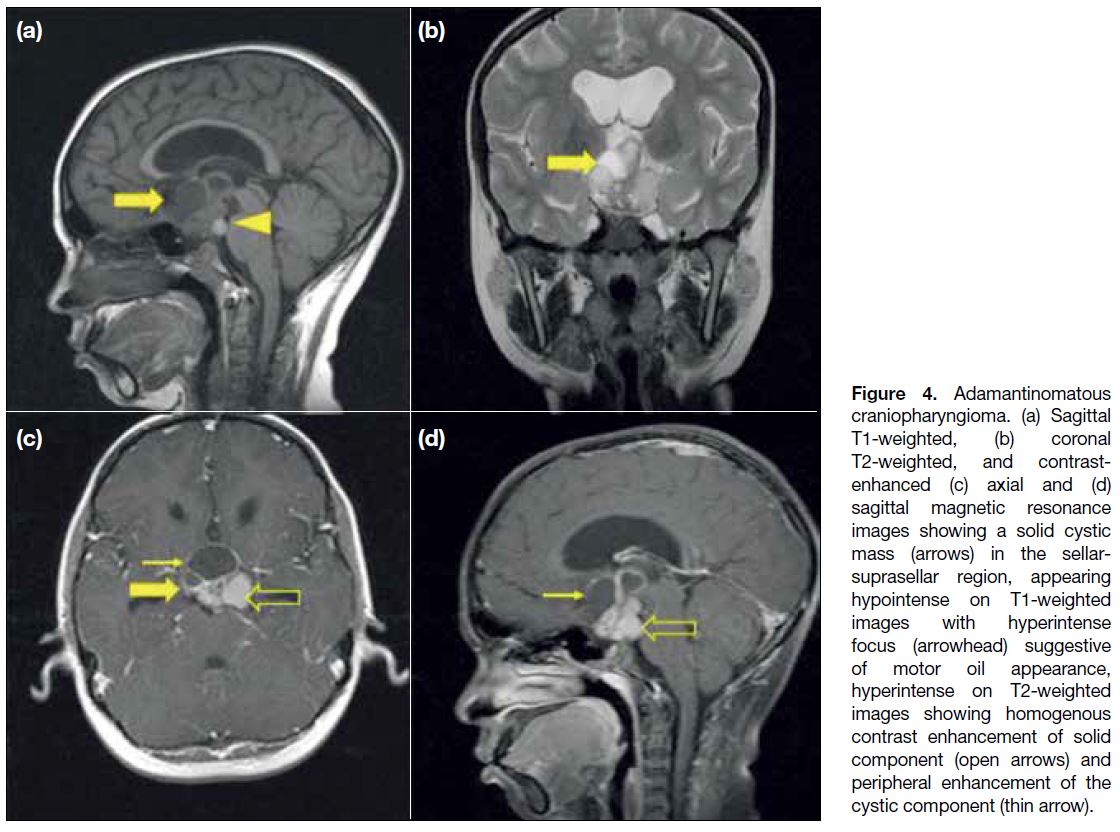
Adamantinomatous craniopharyngiomas on MRI
(Figure 4) appear as lobulated solid-cystic masses in the suprasellar and/or sellar region. Solid components
are isointense on T1W and hyperintense on T2W
images and show enhancement. The cyst contents can
be T1 hyperintense in about 33% cases due to high
proteinaceous / cholesterol / haemorrhagic content,
referred to as ‘Motor-oil’ appearance[7] (Figure 4a).
Figure 4. Adamantinomatous
craniopharyngioma. (a) Sagittal T1-weighted, (b) coronal T2-weighted, and contrast-enhanced (c) axial and (d) sagittal magnetic resonance images showing a solid cystic mass (arrows) in the sellar-suprasellar region, appearing hypointense on T1-weighted images with hyperintense focus (arrowhead) suggestive of motor oil appearance, hyperintense on T2-weighted images showing homogenous contrast enhancement of solid component (open arrows) and peripheral enhancement of the cystic component (thin arrow).
Germ Cell Tumours
Germ cell tumours are classified as germinomatous germ
cell tumours or non-germinomatous GCTs. They usually
arise in the pineal region, followed by the suprasellar
cistern. Smaller lesions tend to be homogenous and are
centred in the pituitary stalk. Thickening of the pituitary
stalk with absence of the normal T1 hyperintense
neurohypophysis bright spot may be seen. Larger lesions
tend to be solid-cystic in appearance (Figure 5), with the
solid component usually being isointense to hypointense
on T2W imaging. The lesions show heterogenous
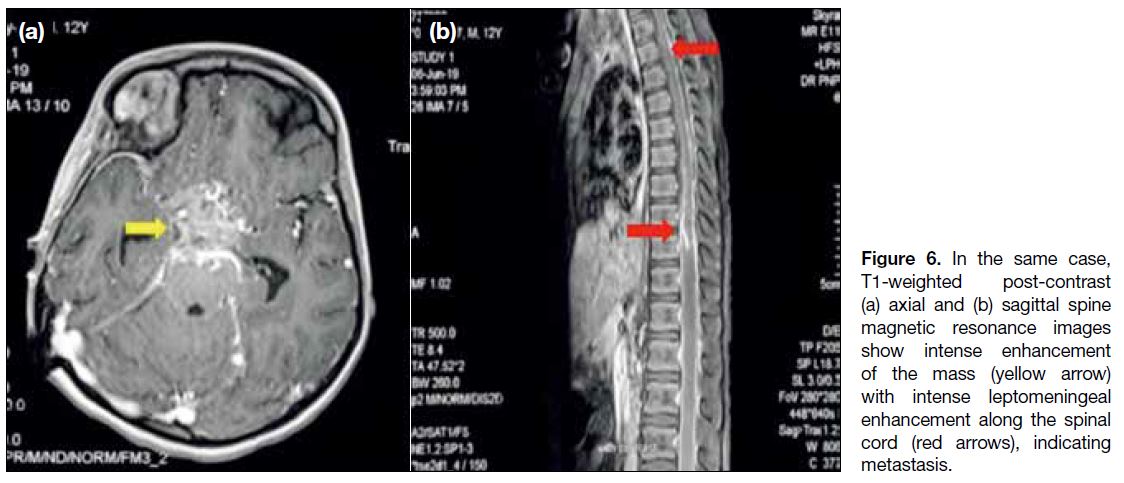
post-contrast enhancement (Figure 6a). The risk of
leptomeningeal dissemination emphasises the importance
of imaging the entire craniospinal axis[8] (Figure 6b).
Figure 5. Germ cell tumours.
(a) Sagittal T1-weighted and (b to d) axial T2-weighted magnetic resonance imaging images showing a solid lesion (arrow) in the sella-suprasellar region appearing hypointense on T1-weighted images and isointense on T2-weighted images. Encasement of bilateral proximal middle cerebral arteries (open arrows), bilateral internal carotid arteries (thin arrows), and posterior encasement of the basilar artery (arrowhead) are evident.
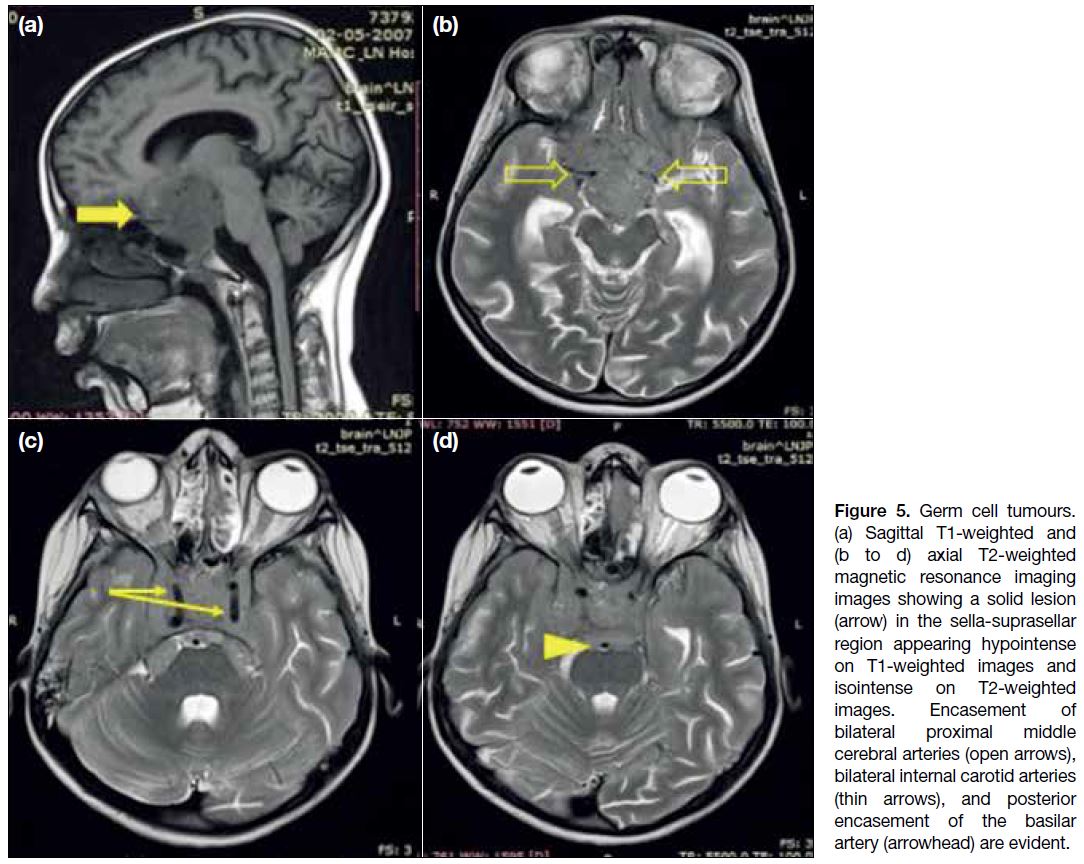
Figure 6. In the same case,
T1-weighted post-contrast (a) axial and (b) sagittal spine magnetic resonance images show intense enhancement of the mass (yellow arrow) with intense leptomeningeal enhancement along the spinal cord (red arrows), indicating metastasis.
Synchronous involvement of the pineal and suprasellar
regions may be evident in up to 15% of cases and are
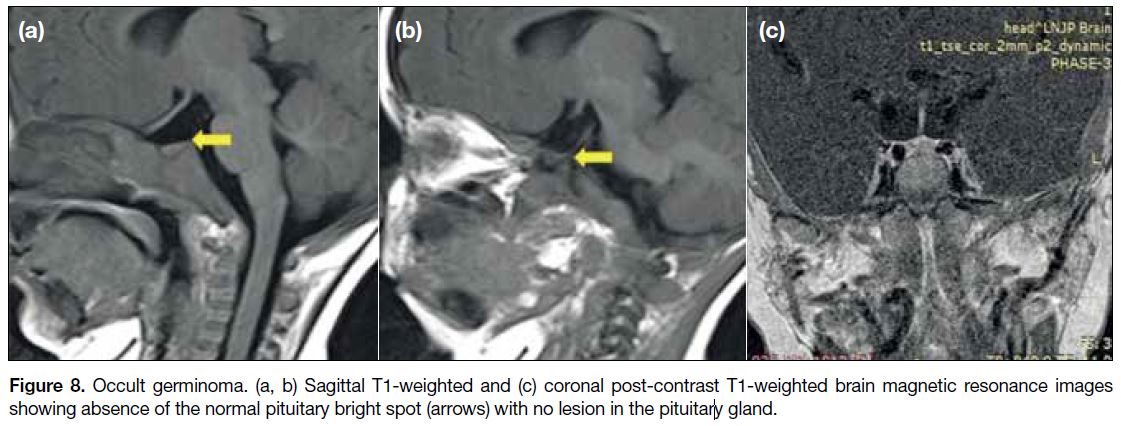
termed bifocal germinomas[9] (Figure 7). Cases of occult germinomas show only the absence of a posterior
pituitary bright spot on MRI with an infundibular mass
seen on follow-up scans after 14 months[10] (Figure 8).
Figure 7. Bifocal germinoma.
(a) Sagittal and (b) axial post-contrast brain magnetic resonance imaging images showing a solid enhancing lesion arrow) in the sellar-suprasellar region with a similar enhancing lesion in the pineal region (thin arrow).
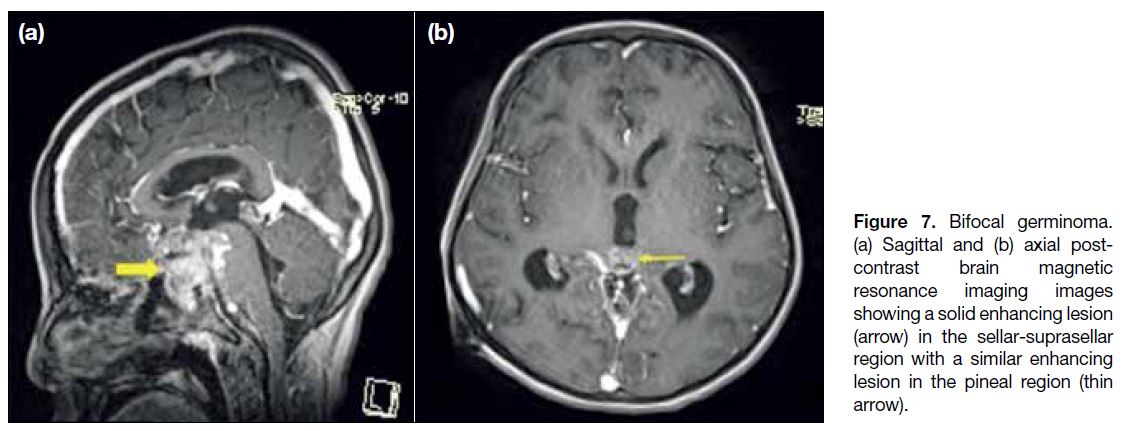
Figure 8. Occult germinoma. (a, b) Sagittal T1-weighted and (c) coronal post-contrast T1-weighted brain magnetic resonance images
showing absence of the normal pituitary bright spot (arrows) with no lesion in the pituitary gland.
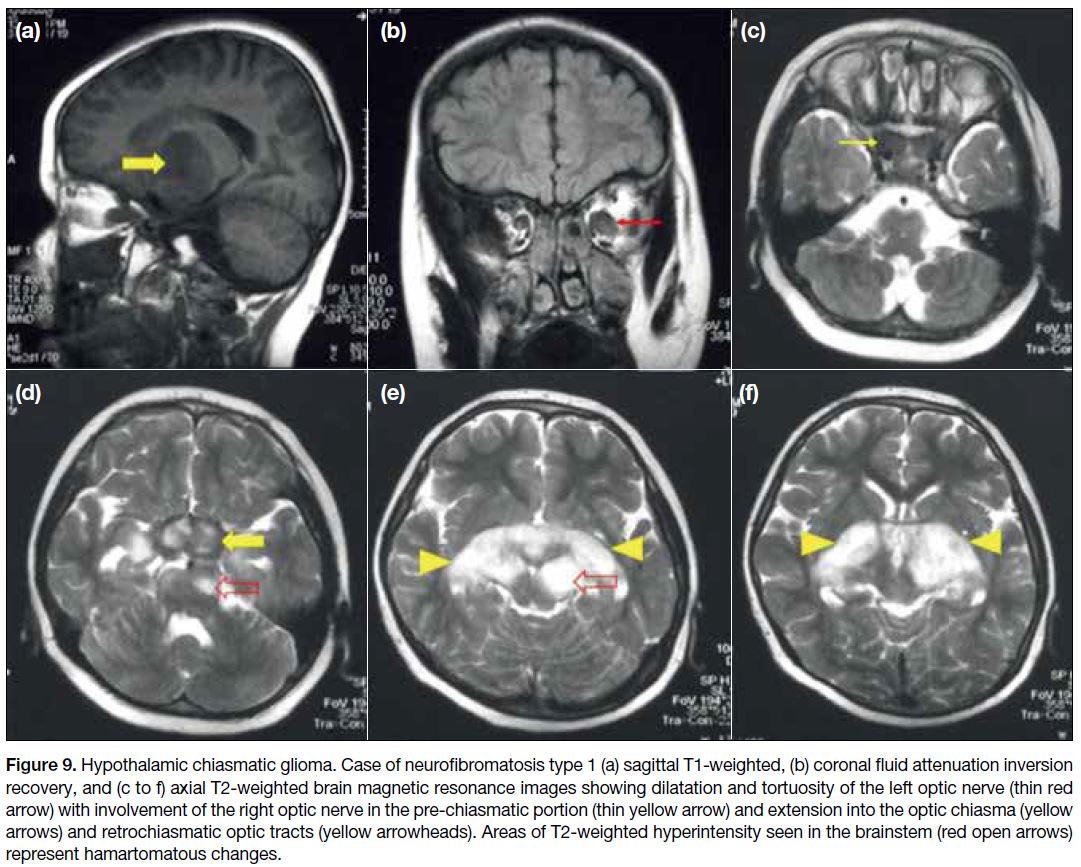
Hypothalamic Chiasmatic Glioma
Hypothalamic chiasmatic glioma (HCGs) are mostly
low-grade World Health Organization grade I
astrocytomas and invade the brain along the optic
pathways. Around 20% to 50% of the HCGs are
associated with neurofibromatosis type 1 (NF1).[5] In
patients with NF1, the optic nerve is usually affected,
resulting in fusiform expansion and kinking. Sporadic
non-NF1-associated hypothalamic-chiasmatic gliomas
show chiasmatic involvement more commonly with
posterior extension beyond the optic pathways.[8] On MRI
(Figure 9), HCGs appear as lobulated suprasellar
masses, hypo- to iso-intense to grey matter on T1W and
hyperintense on T2W images. Intense enhancement is
seen following intravenous contrast administration in
sporadic HCGs while enhancement is variable in HCGs associated with NF1.[11] Distinguishing hypothalamic
gliomas from optic chiasm gliomas can be challenging
and is typically determined by locating the epicentre of
the lesion and determining optic nerve involvement.
Figure 9. Hypothalamic chiasmatic glioma. Case of neurofibromatosis type 1 (a) sagittal T1-weighted, (b) coronal fluid attenuation inversion
recovery, and (c to f) axial T2-weighted brain magnetic resonance images showing dilatation and tortuosity of the left optic nerve (thin red
arrow) with involvement of the right optic nerve in the pre-chiasmatic portion (thin yellow arrow) and extension into the optic chiasma (yellow
arrows) and retrochiasmatic optic tracts (yellow arrowheads). Areas of T2-weighted hyperintensity seen in the brainstem (red open arrows)
represent hamartomatous changes.
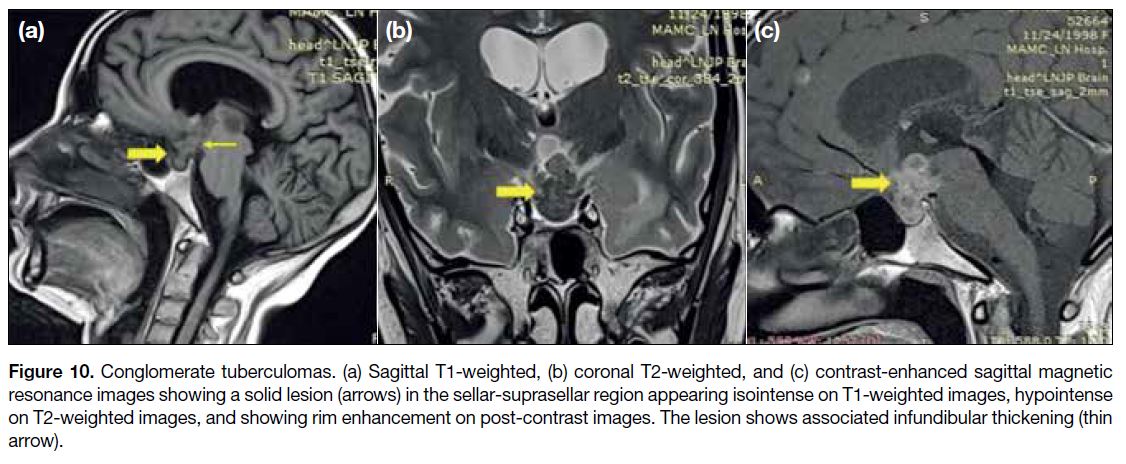
Sellar and Suprasellar Tuberculosis
Sellar tuberculosis represents granulomatous
hypophysitis associated with tuberculosis infection.
Involvement of the pituitary stalk and sella may be
evidenced by thickened, nodular, enhancing stalk
and multiple T2 hypointense, peripherally enhancing
conglomerate tuberculomas in the sellar and suprasellar
region (Figure 10). The presence of parenchymal
tuberculomas, nodular leptomeningeal enhancement in
basal cisterns and perivascular spaces, help suggest the
appropriate diagnosis.[1]
Figure 10. Conglomerate tuberculomas. (a) Sagittal T1-weighted, (b) coronal T2-weighted, and (c) contrast-enhanced sagittal magnetic
resonance images showing a solid lesion (arrows) in the sellar-suprasellar region appearing isointense on T1-weighted images, hypointense
on T2-weighted images, and showing rim enhancement on post-contrast images. The lesion shows associated infundibular thickening (thin
arrow).
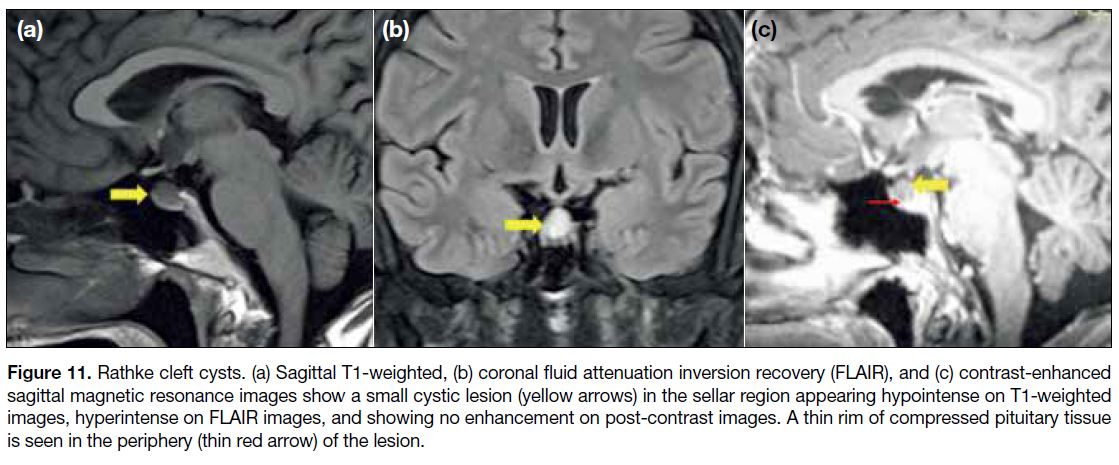
Rathke Cleft Cyst
Rathke cleft cyst (RCC) is a cystic remnant of the Rathke
pouch that has failed to involute during development.
They are less common and smaller in size in children. On imaging, Rathke cleft cysts (Figure 11) can be entirely
intrasellar; intrasellar with suprasellar extension; or
uncommonly entirely suprasellar. The T1 signal varies
depending on the content of the cyst, being hypointense with serous cystic contents and hyperintense with
proteinaceous / mucoid content. The cyst walls usually
do not enhance, but pseudo-enhancement of the walls
can be seen if the pituitary gland is compressed along
the cyst wall.
Figure 11. Rathke cleft cysts. (a) Sagittal T1-weighted, (b) coronal fluid attenuation inversion recovery (FLAIR), and (c) contrast-enhanced
sagittal magnetic resonance images show a small cystic lesion (yellow arrows) in the sellar region appearing hypointense on T1-weighted
images, hyperintense on FLAIR images, and showing no enhancement on post-contrast images. A thin rim of compressed pituitary tissue
is seen in the periphery (thin red arrow) of the lesion.
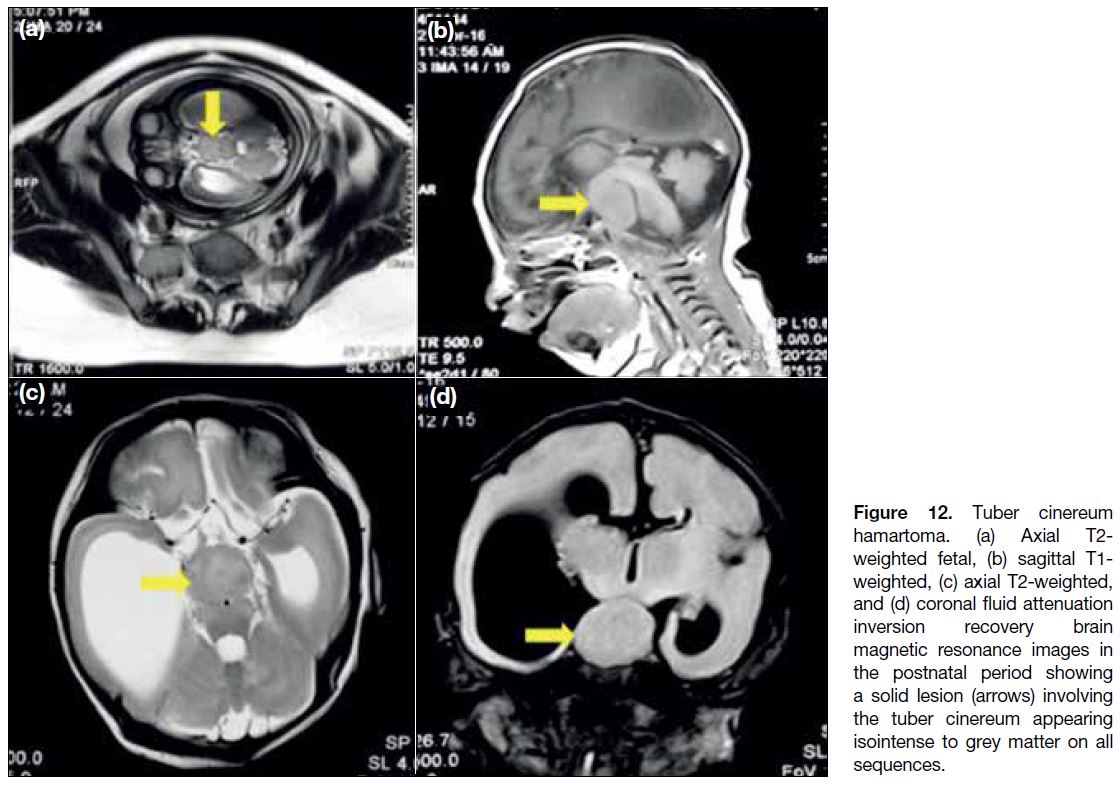
Tuber Cinereum Hamartoma
Tuber cinereum hamartomas are congenital grey matter
heterotopias in the hypothalamic region and can be
detected on antenatal ultrasound. These masses follow
grey matter signal on all sequences and do not enhance
(Figure 12). The clinical presentation varies with the
anatomical location of the lesion. Hamartomas that
arise from the floor of the third ventricle project into
the interpeduncular cistern and present with precocious
puberty. Sessile hamartomas arise from the walls of
lower third ventricles. Patients present with gelastic
seizures and precocious puberty.[12]
Figure 12. Tuber cinereum
hamartoma. (a) Axial T2-weighted fetal, (b) sagittal T1-weighted, (c) axial T2-weighted, and (d) coronal fluid attenuation inversion recovery brain magnetic resonance images in the postnatal period showing a solid lesion (arrows) involving the tuber cinereum appearing isointense to grey matter on all sequences.
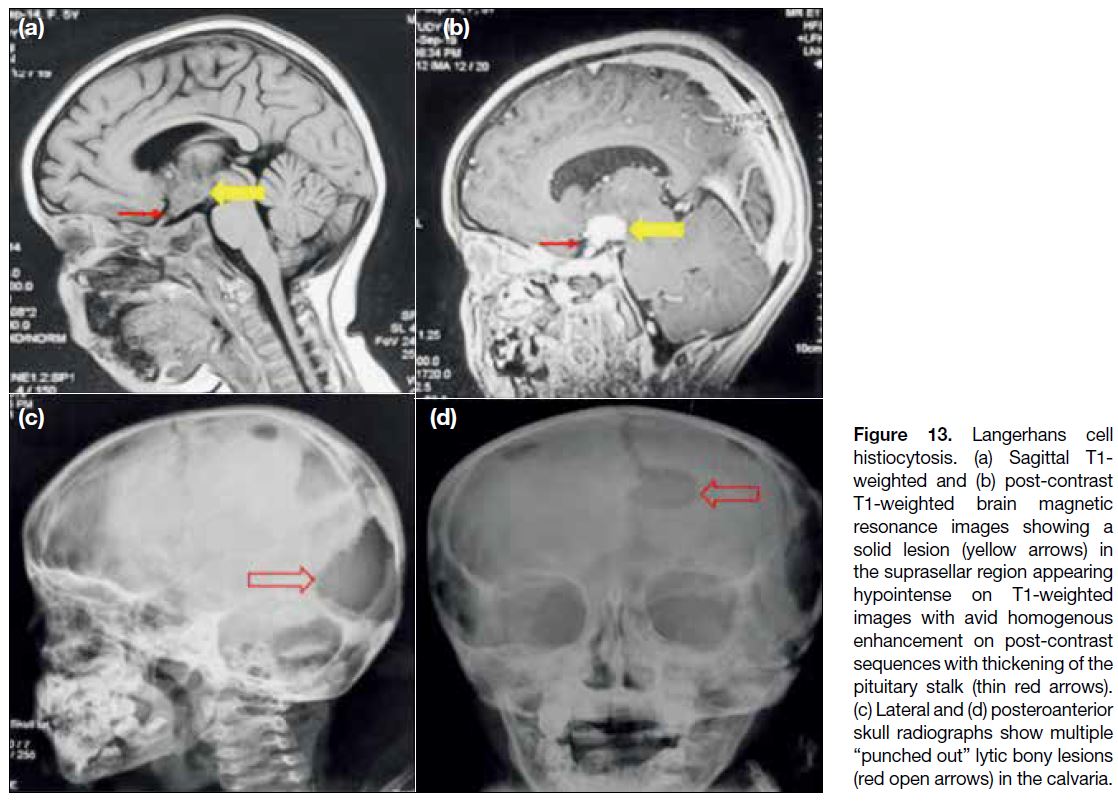
Langerhans Cell Histiocytosis
Langerhans cell histiocytosis (LCH) is an idiopathic disorder that involves the central nervous system in
4% of the paediatric cases. In multicentric LCH, the
hypothalamus and pituitary infundibulum are infiltrated
in up to 20% of cases.[13] These cases show focal or diffuse thickening of the infundibulum and absence of
posterior pituitary bright spot (Figure 13a and b). There
is significant overlap of imaging findings between
germinomas and LCH. However, calvarial involvement
with lytic punched-out bone lesions in the skull
(Figure 13c and d) is a finding typically encountered in LCH.
Figure 13. Langerhans cell
histiocytosis. (a) Sagittal T1-weighted and (b) post-contrast T1-weighted brain magnetic resonance images showing a solid lesion (yellow arrows) in the suprasellar region appearing hypointense on T1-weighted images with avid homogenous enhancement on post-contrast sequences with thickening of the pituitary stalk (thin red arrows). (c) Lateral and (d) posteroanterior skull radiographs show multiple “punched out” lytic bony lesions (red open arrows) in the calvaria.
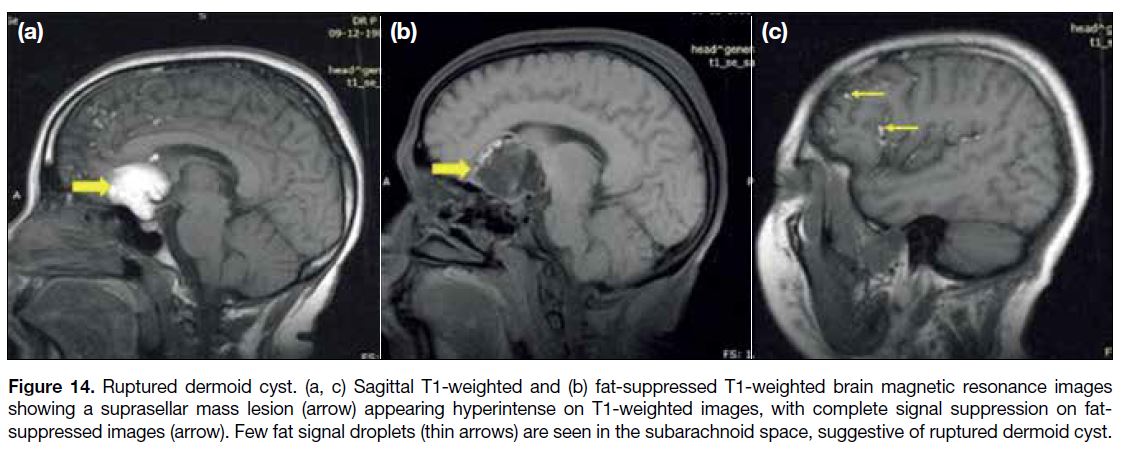
Dermoid and Epidermoid Cysts
These are congenital inclusion cysts. Dermoid cysts
are midline extra-axial lesions. They contain variable
amounts of dermal derivatives. MRI features depend
on the content of the cyst. They are well-defined
spherical or lobulated lesions that appear hyperintense
on T1W (when fat is present) [Figure 14a] and show
heterogenous signal intensity on T2W images. These
lesions do not enhance (Figure 14b). Fat-saturated images can be acquired to show signal dropout of fatty
component. Numerous T1 hyperintense foci are seen
involving in the subarachnoid spaces in cases of ruptured
dermoid cysts (Figure 14c.
Figure 14. Ruptured dermoid cyst. (a, c) Sagittal T1-weighted and (b) fat-suppressed T1-weighted brain magnetic resonance images
showing a suprasellar mass lesion (arrow) appearing hyperintense on T1-weighted images, with complete signal suppression on fat-suppressed
images (arrow). Few fat signal droplets (thin arrows) are seen in the subarachnoid space, suggestive of ruptured dermoid cyst.
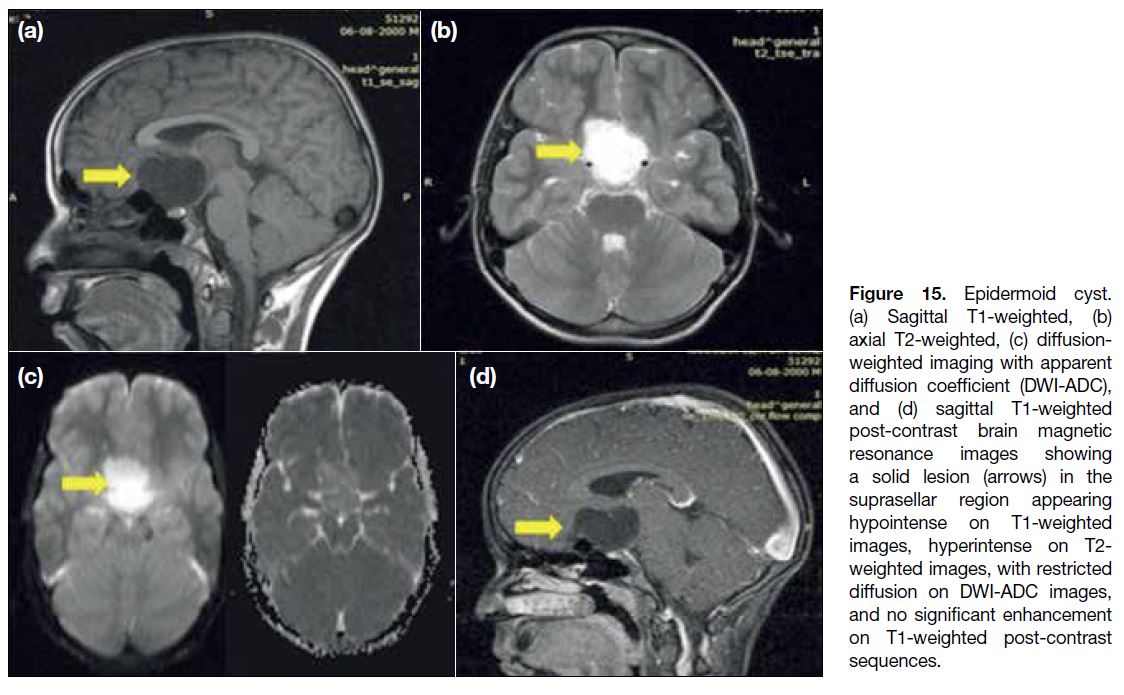
Epidermoid cysts are off-midline extra-axial lesions.
The epidermoids with low protein content follow the cerebrospinal fluid (CSF) signal intensity on
conventional sequences with partial suppression on
fluid attenuation inversion recovery sequences and no
contrast enhancement (Figure 15a, b and d). However,
the definitive diagnosis can be suggested by diffusion
weighted imaging, where epidermoids show true
diffusion restriction (Figure 15c).
Figure 15. Epidermoid cyst.
(a) Sagittal T1-weighted, (b) axial T2-weighted, (c) diffusion-weighted imaging with apparent diffusion coefficient (DWI-ADC), and (d) sagittal T1-weighted post-contrast brain magnetic resonance images showing a solid lesion (arrows) in the suprasellar region appearing hypointense on T1-weighted images, hyperintense on T2-weighted images, with restricted diffusion on DWI-ADC images, and no significant enhancement on T1-weighted post-contrast sequences.
Metastasis
Metastasis to the sellar and suprasellar region can
disseminate through both CSF seeding and via a
haematogenous route. The most favoured site for
metastatic deposits via CSF spread is the infundibular recess. The posterior pituitary gland and the
pituitary stalk are common sites of involvement in
haematogenous metastasis. Intracranial tumours
with a high predilection for CSF dissemination
include medulloblastoma, ependymoma, germinoma, pineoblastoma, neuroblastoma of the skull base and
lymphomatous tumours. The MRI features of metastatic
disease depend on the underlying primary tumour and
include focal sellar/parasellar lesions with/without
leptomeningeal enhancement[14] (Figures 16 and 17).
Figure 16. Suprasellar metastases from medulloblastoma. (a) Sagittal T1-weighted, (b) axial T2-weighted, and (c) post-contrast T1-weighted
brain magnetic resonance images showing a solid mass in the posterior fossa (yellow arrows) and sellar-suprasellar region (thin red arrows),
appearing hypointense on T1-weighted and T2-weighted images with heterogenous post-contrast enhancement on T1-weighted post-contrast
sequences.
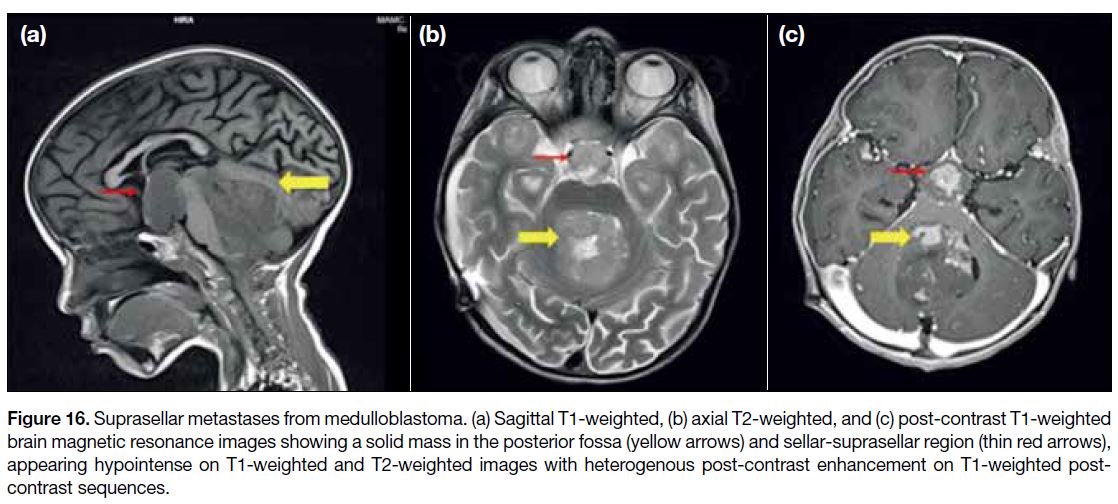
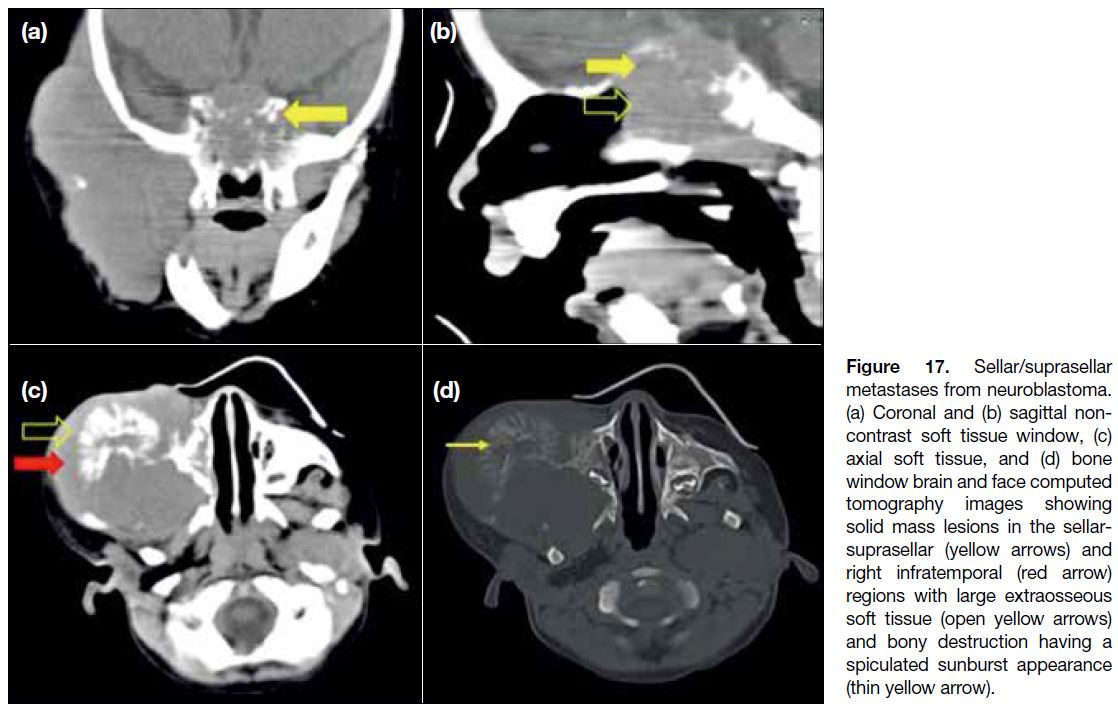
Figure 17. Sellar/suprasellar metastases from neuroblastoma. (a) Coronal and (b) sagittal non-contrast soft tissue window, (c) axial soft tissue, and (d) bone window brain and face computed tomography images showing solid mass lesions in the sellar-suprasellar (yellow arrows) and right infratemporal (red arrow) regions with large extraosseous soft tissue (open yellow arrows) and bony destruction having a spiculated sunburst appearance (thin yellow arrow).
Vascular Malformations
Many vascular anomalies may involve the parasellar
region, including cavernous malformations, carotid-cavernous
fistulas, arterial aneurysms of the ophthalmic
artery, arteriovenous malformations, and venous
malformations. Cavernous malformations are the most
common. Vascular malformations are commonly
seen as T2 hyperintense lesions with hypointense
rim representing haemosiderin; however, high-flow
vascular malformations may show flow voids and
appear T2 hypointense. Carotid-cavernous fistulas are
best demonstrated on MR angiography that shows the
fistulous communication (Figure 18).
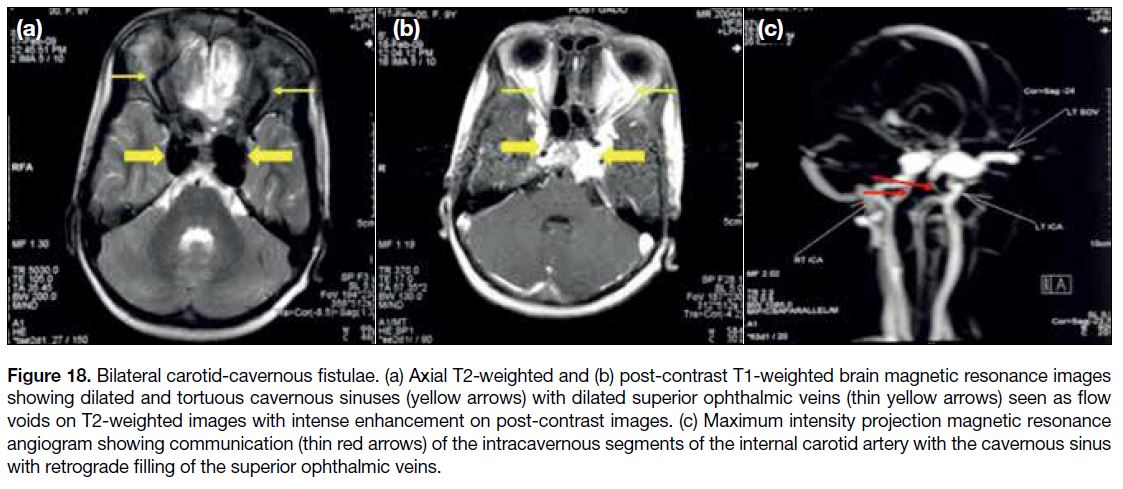
Figure 18. Bilateral carotid-cavernous fistulae. (a) Axial T2-weighted and (b) post-contrast T1-weighted brain magnetic resonance images
showing dilated and tortuous cavernous sinuses (yellow arrows) with dilated superior ophthalmic veins (thin yellow arrows) seen as flow
voids on T2-weighted images with intense enhancement on post-contrast images. (c) Maximum intensity projection magnetic resonance
angiogram showing communication (thin red arrows) of the intracavernous segments of the internal carotid artery with the cavernous sinus
with retrograde filling of the superior ophthalmic veins.
CONCLUSION
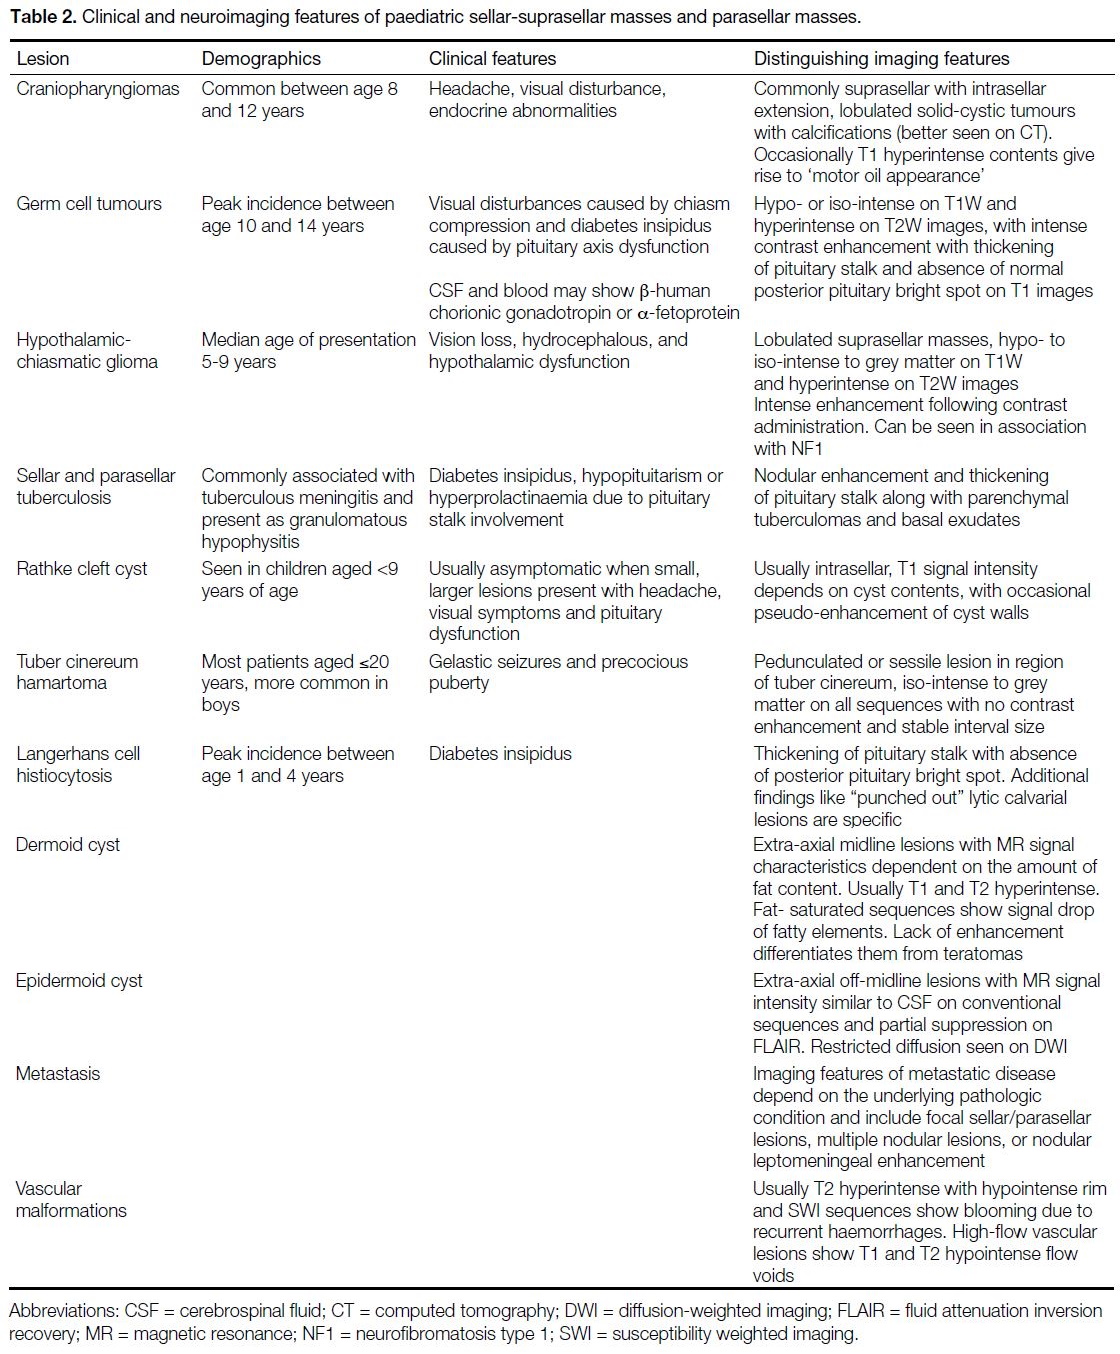
Sellar and parasellar masses are not uncommon in the
paediatric age-group. Their type and frequency differ
to those encountered in adults. Craniopharyngiomas
represent almost half of sellar region tumours in
children, followed by hypothalamic-chiasmatic
gliomas, hypothalamic hamartomas and germinomas.
Assessment of the site of origin, signal characteristics and
enhancement patterns along with clinical presentation
and age of the child can help narrow the differentials and
reach a definitive diagnosis (Table 2).
Table 2. Clinical and neuroimaging features of paediatric sellar-suprasellar masses and parasellar masses.
REFERENCES
1. Seeburg DP, Dremmen MH, Huisman TA. Imaging of the sella and parasellar region in the pediatric population. Neuroimaging
Clin N Am. 2017;27:99-121. Crossref
2. Taylor M, Couto-Silva AC, Adan L, Trivin C, Sainte-Rose C,
Zerah M, et al. Hypothalamic-pituitary lesions in pediatric patients:
endocrine symptoms often precede neuro-ophthalmic presenting
symptoms. J Pediatr. 2012;161:855-63. Crossref
3. Kitamura E, Miki Y, Kawai M, Itoh H, Yura S, Mori N, et al. T1 signal intensity and height of the anterior pituitary in neonates:
correlation with postnatal time. AJNR Am J Neuroradiol.
2008;29:1257-60. Crossref
4. Bourekas EC, Miller JW, Christoforidis GA. Masses of the sellar
and juxtasellar region. In: Drevelegas A, editor. Imaging of Brain
Tumors with Histological Correlations. Heidelberg (Berlin):
Springer; 2002. p 227-52. Crossref
5. Plaza MJ, Borja MJ, Altman N, Saigal G. Conventional
and advanced MRI features of pediatric intracranial tumors:
posterior fossa and suprasellar tumors. AJR Am J Roentgenol.
2013;200:1115-24. Crossref
6. Karavitaki N, Wass JA. Craniopharyngiomas. Endocrinol Metab
Clin North Am. 2008;37:173-93. Crossref
7. Kumar J, Kumar A, Sharma R, Vashisht S. Magnetic resonance
imaging of sellar and suprasellar pathology: a pictorial review. Curr
Probl Diagn Radiol. 2007;36:227-36. Crossref
8. Derman A, Shields M, Davis A, Knopp E, Fatterpekar GM.
Diseases of the sella and parasellar region: an overview. Semin
Roentgenol. 2013;48:35-51. Crossref
9. Echevarría ME, Fangusaro J, Goldman S. Pediatric central nervous
system germ cell tumors: a review. Oncologist. 2008;13:690-9. Crossref
10. Mootha SL, Barkovich AJ, Grumbach MM, Edwards MS,
Gitelman SE, Kaplan SL, et al. Idiopathic hypothalamic diabetes
insipidus, pituitary stalk thickening, and the occult intracranial
germinoma in children and adolescents. J Clin Endocrinol Metab.
1997;82:1362-7. Crossref
11. Vinhais S, Nunes S, Salgado D. Optic gliomas in children — a
review on MR imaging findings. Annual Meeting of the European
Congress of Radiology; 2015 March 4-8; Vienna, Austria. Poster C-1676.
12. Papadopoulou E, Chourmouzi D, Drevelegas A. Pediatric sellar: suprasellar tumors. J Pediatr Neuroradiol. 2016;5:82-8. Crossref
13. Demaerel P, Van Gool S. Paediatric neuroradiological aspects of Langerhans cell histiocytosis. Neuroradiology. 2008;50:85-92. Crossref
14. Rao VJ, James RA, Mitra D. Imaging characteristics of common
suprasellar lesions with emphasis on MRI findings. Clin Radiol.
2008;63:939-47. Crossref