Optimisation of Gadolinium and Iodinated Contrast Ratio for 1.5T and 3T MR Arthrography: An In Vitro Study
ORIGINAL ARTICLE
Optimisation of Gadolinium and Iodinated Contrast Ratio for
1.5T and 3T MR Arthrography: An In Vitro Study
CKM Mo, KY Cho, AKY Au, CY Chu
Department of Radiology, Pamela Youde Nethersole Eastern Hospital, Hong Kong
Correspondence: Dr CKM Mo, Department of Radiology, Pamela Youde Nethersole Eastern Hospital, Hong Kong. Email: cyrus.mo@gmail.com
Submitted: 4 May 2020; Accepted: 16 Oct 2020.
Contributors: CKMM and KYC designed the study. All authors acquired the data, analysed the data, and drafted the manuscript. KYC, AKYA,
and CYC made critical revisions to the manuscript for important intellectual content. All authors had full access to the data, contributed to the
study, approved the final version for publication, and take responsibility for its accuracy and integrity.
Conflicts of Interest: All authors have disclosed no conflicts of interest.
Funding/Support: The funder had no role in study design, data collection/analysis/interpretation or manuscript preparation.
Data Availability: All data generated or analysed during the present study are available from the corresponding author on reasonable request.
Ethics Approval: The study was approved by the Hong Kong East Cluster research ethics committee (Ref: HKECREC-2020-021). All patients
provided written informed consent.
Abstract
Objectives
To determine the optimal ratio of gadolinium to iodine for 1.5T and 3T magnetic resonance (MR) arthrography.
Methods
An in vitro model with a mixture of six concentrations of gadolinium (0.02, 0.01, 0.005, 0.0025, 0.00125
and 0.000625 mmol/mL) and six concentrations of iodine (297, 225, 150, 112.5, 75 and 37.5 mg I/mL) were first
scanned with fluoroscopy, then with 1.5T and 3T MR scanners, each acquiring a T1-weighted imaging sequence, a
T2-weighted imaging sequence, and a proton density (PD) sequence. The concentrations of gadolinium and iodine
were plotted against radiopacity and signal-to-noise ratio (SNR). Spearman’s rank correlation coefficient test was
used to investigate the correlation between radiopacity/SNR and concentrations of the two agents.
Results
At 1.5T, the optimal ratio was 0.0025 mmol/mL gadolinium and 37.5 mg I/mL. At 3T, the optimal ratio was
0.00125 mmol/mL gadolinium and 75 mg I/mL. When the optimal ratio for 1.5T was used for 3T, the results were
comparable. There were significant correlations between iodine concentration and SNR in 3T MR T1-weighted
imaging and iodine concentration and SNR in a 3T MR (PD) sequence.
Conclusion
The optimal ratio of gadolinium and iodine concentrations for 1.5T MR arthrography is
0.0025 mmol/mL gadolinium and 37.5 mg I/mL iodine, and that for 3T MR arthrography is 0.00125 mmol/mL gadolinium and 75 mg I/mL iodine, but the concentrations used for T1-weighted imaging at 1.5T also work well at 3T.
Key Words: Gadolinium; Iohexol
中文摘要
體外實驗以確定1.5T及3T磁力共振關節造影術的最佳釓碘顯影劑濃度比例
巫冠文、曹君彥、區嘉殷、朱志揚
目的
確定在1.5T和3T磁力共振關節造影術的最佳釓碘顯影劑濃度比例。
方法
體外實驗模型來自六個濃度的釓顯影劑(0.02、0.01、0.005、0.0025、0.00125及0.000625 mmol/mL)及六個濃度的碘顯影劑(297、225、150、112.5、75及37.5 mg I/mL)的混合物。在螢光透視,1.5T及3T磁力共振的T1W、T2W及質子加權序列影像中,分別測量射線不透性及信雜比。釓碘濃度及射線不透性/信雜比進行作圖,並使用Spearman等級相關係數用作分析它們之間的關聯
結果
於1.5T磁力共振關節造影術中,最佳釓碘顯影劑比例為0.0025 mmol/mL比37.5 mg I/mL。於3T磁力共振關節造影術中,最佳釓碘顯影劑比例為0.00125 mmol/mL比75 mg I/mL。於3T磁力共振中,1.5T的最佳釓碘顯影劑比例效果相若。於3T磁力共振T1加權像及質子密度序列影像中,碘濃度與信雜比有顯著相關。
結論
於1.5T磁力共振關節造影術中,最佳釓碘顯影劑比例為0.0025 mmol/mL比37.5 mg I/mL。於3T磁力共振關節造影術中,最佳釓碘顯影劑比例為0.00125 mmol/mL比75 mg I/mL。1.5T磁力共振下的最佳釓碘比例在3T磁力共振中效果相若。
INTRODUCTION
Magnetic resonance (MR) arthrography using a fixed
concentration of gadolinium in the form of a contrast
agent is an ideal diagnostic modality for assessment of
the internal structure of joints.[1] It is a common practice
to insert the needle under fluoroscopic guidance with
a small iodinated contrast injection to confirm proper
needle placement.[2]
There have been numerous suggested concentrations
of gadolinium for this procedure.[2] [3] [4] [5] [6] [7] A known effect of
iodinated contrast is that it diminishes the signal intensity
of gadolinium in T1-weighted images (T1WI).[5] [6] [7] [8] It is
crucial to optimise the ratio of gadolinium to iodine to
achieve the best signal intensity and minimise signal loss
from iodinated contrast.
We aimed to determine the optimal ratio of gadolinium
to iodine concentration for 1.5T and 3T MR arthrography
using an in vitro approach.
METHODS
Experimental Model
The study was performed using 0.5 mmol/mL gadoteric
acid (Dotarem; Guerbet, France), a macrocyclic ionic
gadolinium-based contrast agent, and with iohexol,
300 mg I/mL (Omnipaque; GE Healthcare, US), a nonionic, monometric, triiodinated, water-soluble
contrast agent. These are used for MR arthrography and
X-ray contrast media, respectively.
Gadoteric acid solutions were prepared at the following
six concentrations diluted using normal saline (0.9%
sodium chloride): 0.02 mmol/mL (1:25 dilution),
0.01 mmol/mL (1:50 dilution), 0.005 mmol/mL
(1:100 dilution), 0.0025 mmol/mL (1:200 dilution),
0.00125 mmol/mL (1:400 dilution), and
0.000625 mmol/mL (1:800 dilution). Iohexol solutions
were prepared at the six concentrations as follows:
297 mg I/mL (99% volume), 225 mg I/mL (75%
volume), 150 mg I/mL (50% volume), 112.5 mg I/mL
(37.5% volume), 75 mg I/mL (25% volume), and
37.5 mg I/mL (12.5% volume). A total of 36 mixtures
of contrasts were obtained, and then placed into two
rectangular-shaped tissue culture plates (24-well plate,
6 × 4, BKMAM). Each well could accommodate
mixtures up to 4 mL. The plates were sealed with lids to
prevent evaporation or spillage.
Fluoroscopy and Magnetic Resonance
Imaging
The plates were placed on a fluoroscopy platform
(Artis zee; Siemens, Germany) and spot images were captured. Subsequently, they were placed in MR image
gantries (1.5T Avanto and 3T Skyra; Siemens) systems
and imaged with a head coil. The field of view was
160 × 160 mm with a matrix of 256 × 256 pixels for
all sequences in both systems. All the sequences (T1WI
with repetition time and echo time [TR/TE]: 400/13 ms,
T2-weighted images with TR/TE: 4000/60-84 ms, and
proton density [PD] with TR/TE: 2200-3500/24-30 ms)
were acquired in the coronal plane with section thickness
of 8 mm.
Image Analysis and Data Collection
The images were transferred to a picture archiving and
communication systems server and were analysed on
workstations with medical imaging software (Carestream,
Rochester NY, US). A region of interest 1.0 cm in
diameter was placed at the centre of each well to measure
the radiopacities and signal intensities. In addition, six
background radiopacity or signal intensity measurements
were obtained. Each measurement was performed
5 times. Maximum and minimum measurements were
discarded and means of the remaining three values were
calculated. Radiopacity and signal-to-noise ratio (SNR)
were determined using the following equations:
Radiopacity = Radiopacity mean / Radiopacity background
SNR = Signal intensity well / Signal intensity background
Radiopacity = Radiopacity mean / Radiopacity background
SNR = Signal intensity well / Signal intensity background
Radiopacity/SNR were plotted against concentrations of
iodine/gadolinium mixtures. The optimal concentrations
of gadolinium and iodine were determined.
Statistical Analysis
The Kruskal–Wallis test was used to identify any significant differences between radiopacities/SNRs
and iodine/gadolinium concentrations; Spearman’s
rank correlation coefficients were used to determine
correlations between the two mixtures. All statistical
computations were performed in SPSS (Windows
version 16.0; SPSS Inc, Chicago [IL], US). All p values
<0.05 were considered significant.
RESULTS
Fluoroscopy
As expected, there were significant differences in the
radiopacities among the different concentrations of
iodine (p < 0.001), as well as a significant correlation
between radiopacity and concentrations of iodine
(r = 0.977, p < 0.001). No significant difference
(p = 0.999) or correlation (r = 0.052, p = 0.761) in
radiopacities among the six concentrations of gadolinium
mixtures was found (Figure 1).
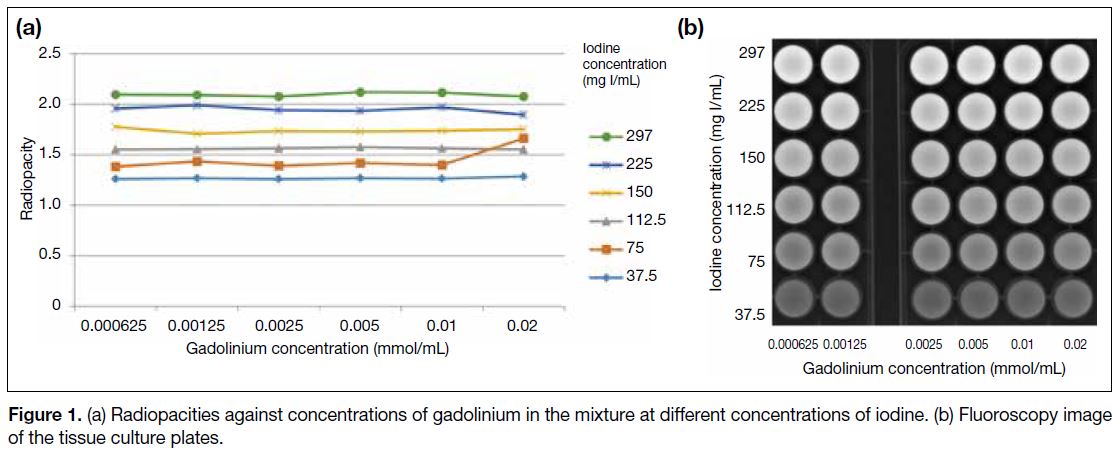
Figure 1. (a) Radiopacities against concentrations of gadolinium in the mixture at different concentrations of iodine. (b) Fluoroscopy image of the tissue culture plates.
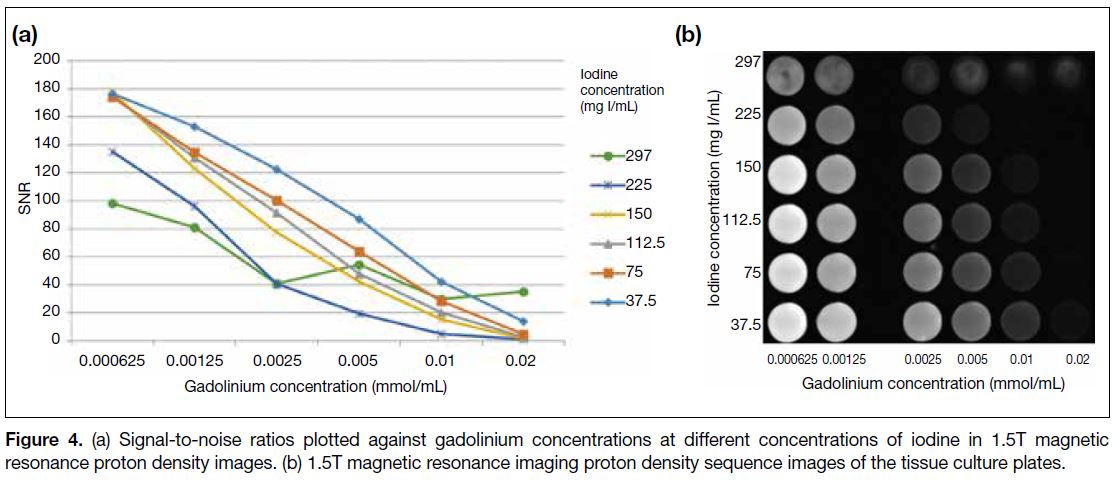
1.5T Magnetic Resonance Imaging
In T1WI, the SNRs generally increased with decreased
concentrations of gadolinium (Figure 2). This trend was
the same in T2-weighted images and PD sequences
(Figures 3 and 4). At higher concentrations of iodine,
the SNR reduced gradually. This effect was independent
of the concentration of gadolinium and MR sequences.
There was no significant correlation between iodine
concentration and SNR in all three sequences (r = -0.327,
p = 0.051; r = -0.204, p = 0.233; r = -0.241, p = 0.157 for
T1, T2 and PD sequences, respectively). The maximal
SNR in the T1 sequence was found in a mixture with
gadolinium 0.0025 mmol/mL (1:200) and 37.5 mg I/mL
(12.5% by volume).
Figure 2. (a) Signal-to-noise ratios plotted against gadolinium concentrations at different concentrations of iodine in 1.5T magnetic resonance T1-weighted images. (b) 1.5T magnetic resonance imaging T1 sequence images of the tissue culture plates.
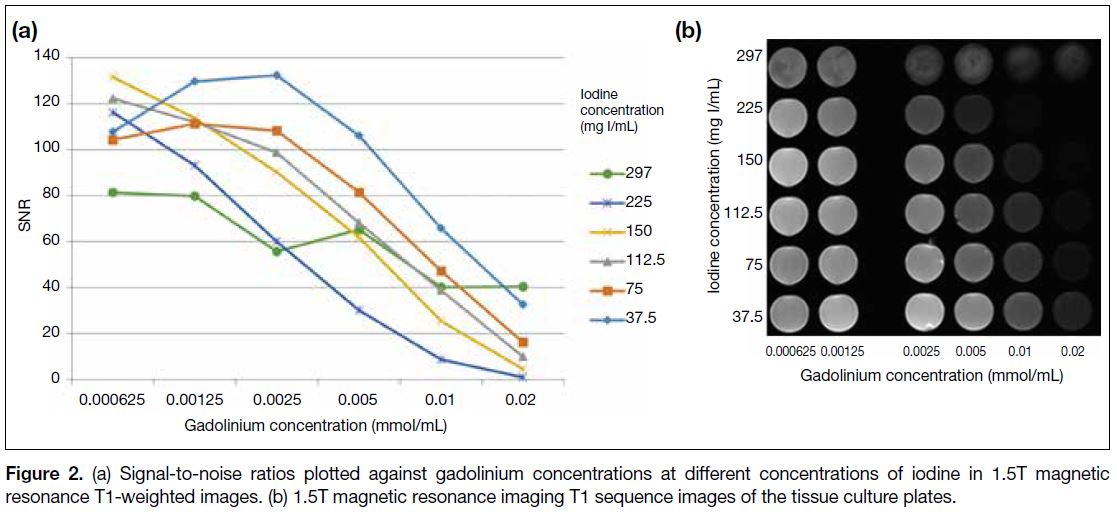
Figure 3. (a) Signal-to-noise ratios plotted against gadolinium concentrations at different concentrations of iodine in 1.5T magnetic resonance T2-weighted images. (b) 1.5T magnetic resonance imaging T2 sequence images of the tissue culture plates.
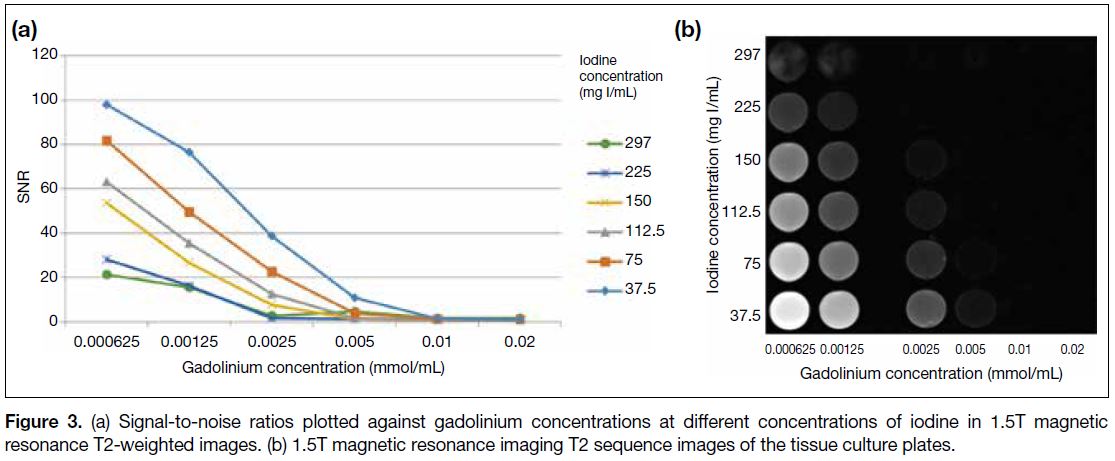
Figure 4. (a) Signal-to-noise ratios plotted against gadolinium concentrations at different concentrations of iodine in 1.5T magnetic resonance proton density images. (b) 1.5T magnetic resonance imaging proton density sequence images of the tissue culture plates.
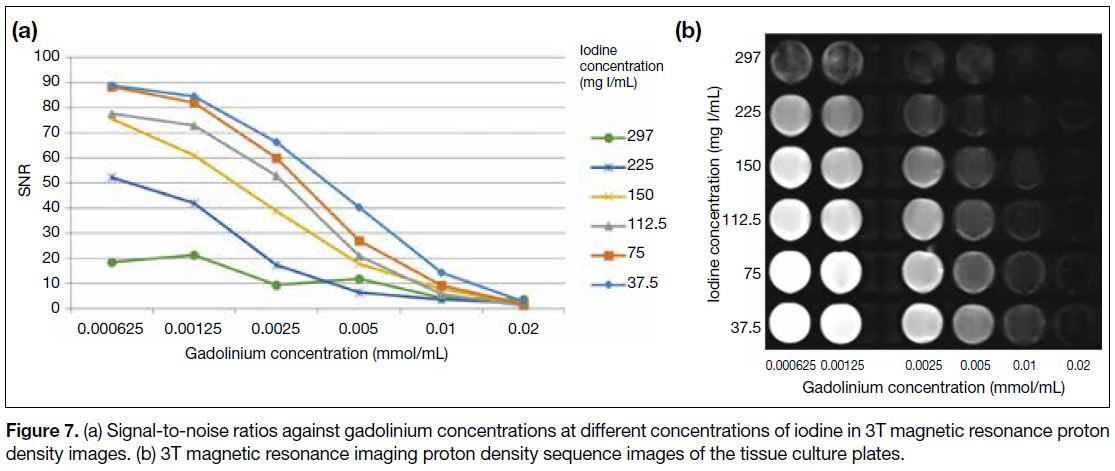
3T Magnetic Resonance Imaging
The results at 3T were roughly similar to those at
1.5T. SNR increased with decreasing gadolinium
concentration in the T1 (Figure 5), T2 (Figure 6), and PD
sequences (Figure 7). However, in the T1 sequence, SNR
was maximised at 0.00125 mmol/mL gadolinium and
75 mg I/mL. There was a significant correlation between
concentrations of iodine and SNRs in 3T MR T1WI and
PD imaging (r = -0.947, p = 0.02; r = -0.354, p = 0.034
for T1 and PD sequences, respectively). No significant
correlation was demonstrated between concentrations of iodine and SNRs in the T2 sequences (r = -0.294, p = 0.081).
Figure 5. (a) Signal-to-noise ratios against gadolinium concentrations at different concentrations of iodine in 3T magnetic resonance T1 images. (b) 3T magnetic resonance imaging T1 sequence images of the tissue culture plates.
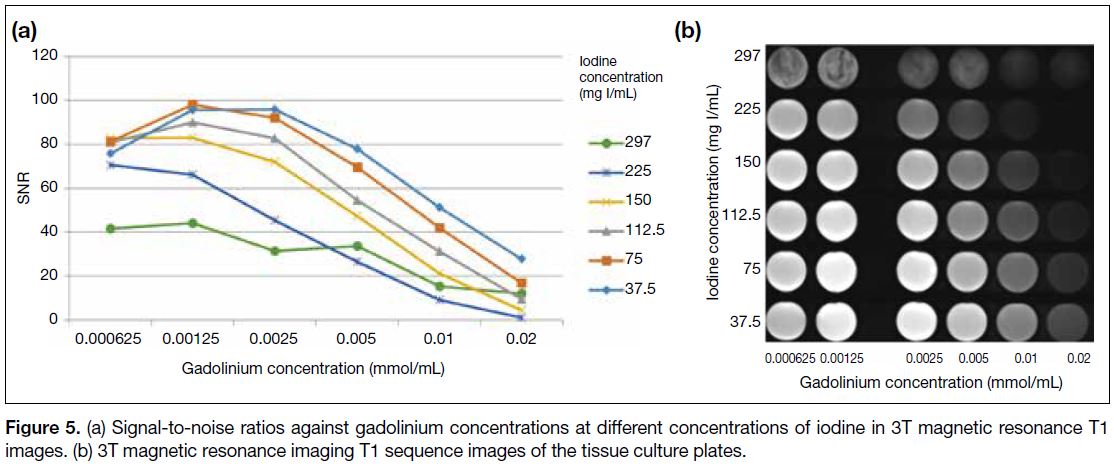
Figure 6. (a) Signal-to-noise ratios against gadolinium concentrations at different concentrations of iodine in 3T magnetic resonance T2 images. (b) 3T magnetic resonance imaging T2 sequence images of the tissue culture plates.
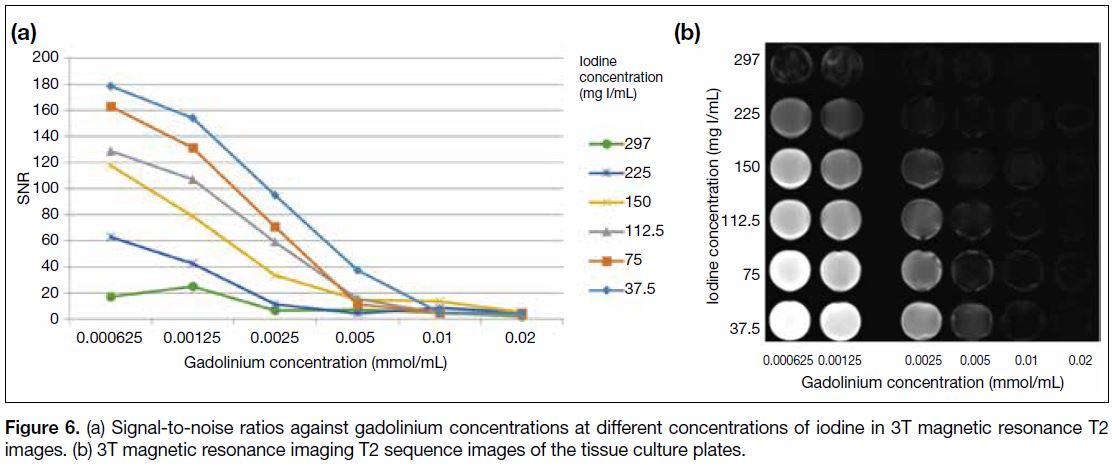
Figure 7. (a) Signal-to-noise ratios against gadolinium concentrations at different concentrations of iodine in 3T magnetic resonance proton density images. (b) 3T magnetic resonance imaging proton density sequence images of the tissue culture plates.
DISCUSSION
Fluoroscopy-guided needle insertion into the joint
space for MR arthrography is a common approach.[2] A
test injection of iodinated contrast is helpful to confirm
needle placement, but it may compromise the signal
intensity derived from gadolinium contrast as shown
in the present study. The reason for keeping a constant
ratio of gadolinium to iodine is to avoid changing of the
syringe and potentially introducing air bubbles.[2]
Although the SNR in 3T MR T1 sequences peaked at
0.00125 mmol/mL gadolinium and 75 mg I/mL, the
resulting image was visually comparable to that of
the mixture with the second-highest SNR, which was
0.0025 mmol/mL gadolinium and 37.5 mg I/mL.
Diluting gadolinium contrast (1:200) is easier to achieve
in the clinical setting. This ratio also gives maximal SNR
at 1.5T, allowing the same concentrations to be used at
3T and 1.5T.
SNRs are generally reduced by increasing the
concentration of iodine in all sequences at both 1.5T and 3T. This is compatible with many prior in vitro studies.[5] [6] [7] [8] [9] [10]
Montgomery et al[8] proposed that this effect could be
related to an increase in the viscosity or reduction in the
PD in the contrast mixtures. Masi et al[6] explained the
reduction of signal intensity by iodinated contrast to be
due to the magnetic susceptibility of iodine.
However, there is an exception to the trend mentioned
above. For 1.5T and 3T MR T1 sequences, at the most
diluted gadolinium concentration (0.000625 mmol/mL),
SNRs were increased with associated iodine
concentrations of 75 to 150 mg I/mL (Figure 2). The effect was more pronounced at 1.5T. This interesting
finding correlates with the findings of Nouh et al.[7] This
synergism may be explained by the extra T1 shortening
effect of iodine.[11] Significant correlations of iodine
concentrations and SNR were found at 3T MR T1 and
PD sequences. In the present study, Spearman’s rank
correlation coefficient test was used, which means the
correlation can be linear or non-linear. Nevertheless,
the correlation was not found in 1.5T MR T1 and PD
sequences.
The results obtained from the present study are within
the recommended range of Masi et al,[6] though we investigated the effects of iodine concentrations on MR
imaging and fluoroscopic images as well. Masi et al6 also
demonstrated that there was no significant difference
between contrast diluted by normal saline and that
diluted by albumin. Therefore, normal saline was used
in the present study.
The optimal gadolinium concentration found in the
present study was higher than that found by Choi et al,[5]
whereas the optimal iodine concentration found in the
present study was lower. This can be explained by the
different aims of the two studies. Choi et al[5] aimed to
determine the optimal contrast ratio for simultaneous computed tomography and MR arthrography; however,
the present study included 3T MR imaging.
Nouh et al[7] determined the optimal concentration of two
gadolinium contrast agents in MR up to 7T but only one
concentration of iodine was used.
There are limitations to the present study. Due to its in
vitro setup, it is difficult to achieve a solution with the
same chemical composition as joint fluid for dilution.
Moreover, fat-saturated sequences were not investigated.
CONCLUSIONS
The optimal ratio of gadolinium and iodine
concentrations for 1.5T MR arthrography is
0.0025 mmol/mL (1:200 dilution) gadolinium to
37.5 mg I/mL (12.5% by volume), and that for 3T MR
arthrography is 0.00125 mmol/mL (1:400 dilution)
gadolinium to 75 mg I/mL (25% by volume) iodine,
but the former concentrations suffice for 3T, allowing a
simplified setup.
REFERENCES
1. Steinbach LS, Palmer WE, Schweitzer ME. Special focus session: MR arthrography. Radiographics. 2002;22:1223-46. Crossref
2. Rastogi AK, Davis KW, Ross A, Rosas HG. Fundamentals of joint injection. AJR Am J Roentgenol. 2016;207:484-94. Crossref
3. Renner JB. Fundamentals of skeletal radiology. Invest Radiol. 1989;24:639. Crossref
4. Catherine Westbrook. Handbook of MRI Technique. Wiley-
Blackwell; 2008: p 424.
5. Choi JY, Heung SK, Hong SH, Lee JW, Kim NR, Jun WS, et al. Optimization of the contrast mixture ratio for simultaneous direct
MR and CT arthrography: an in vitro study. Korean J Radiol.
2008;9:520-5. Crossref
6. Masi JN, Newitt D, Sell CA, Daldrup-Link H, Steinbach L, Majumdar S, et al. Optimization of gadodiamide concentration
for MR arthrography at 3 T. AJR Am J Roentgenol. 2005;184:1754-
61. Crossref
7. Nouh MR, Schweitzer M, Regatte R. Optimal gadolinium
concentration for direct MR arthrography at high field strength up
to 7 T: In vitro model. Egypt J Radiol Nucl Med. 2013;44:283-9. Crossref
8. Montgomery DD, Morrison WB, Schweitzer ME, Weishaupt D, Dougherty L. Effects of iodinated contrast and field strength on
gadolinium enhancement: Implications for direct MR arthrography.
J Magn Reson Imaging. 2002;15:334-43. Crossref
9. Andreisek G, Froehlich JM, Hodler J, Weishaupt D, Beutler V,
Pfirrmann CW, et al. Direct MR arthrography at 1.5 and 3.0 T:
signal dependence on gadolinium and iodine concentrations — phantom study. Radiology. 2008;247:706-16. Crossref
10. Kopka L, Funke M, Fischer U, Keating D, Oestmann J, Grabbe E.
MR arthrography of the shoulder with gadopentetate dimeglumine:
influence of concentration, iodinated contrast material, and time on
signal intensity. AJR Am J Roentgenol. 1994;163:621-3. Crossref
11. Jinkins JR, Robinson JW, Sisk L, Fullerton GD, Williams RF.
Proton relaxation enhancement associated with iodinated contrast
agents in MR imaging of the CNS. AJNR Am J Neuroradiol.
1992;13:19-27.