
T2 Dark Lesions of the Musculoskeletal System: A Pictorial Essay
PICTORIAL ESSAY
T2 Dark Lesions of the Musculoskeletal System: A Pictorial Essay
S Badkhane, S Singh, R Dixit, A Garg
Department of Radiodiagnosis, Maulana Azad Medical College, New Delhi, India
Correspondence: Dr S Badkhane, Department of Radiodiagnosis, Maulana Azad Medical College, New Delhi, India. Email: shru_b01@rediffmail.com
Submitted: 3 Aug 2020; Accepted: 6 Nov 2020.
Contributors: All authors designed the study, acquired the data, analysed the data, drafted the manuscript, and critically revised the manuscript
for important intellectual content. All authors had full access to the data, contributed to the study, approved the final version for publication, and
take responsibility for its accuracy and integrity.
Conflicts of Interest: All authors have disclosed no conflicts of interest.
Funding/Support: This study received no specific grant from any funding agency in the public, commercial, or not-for-profit sectors.
Data Availability: All data generated or analysed during the present study are available from the corresponding author on reasonable request.
Ethics Approval: All patients were treated in accordance with the tenets of the Declaration of Helsinki. The patients provided written informed consent for all treatments and procedures.
INTRODUCTION
A T2 ‘dark’ or hypointense lesion is one that shows
signal intensity lower than that of muscle on T2-weighted
(T2W) sequences on magnetic resonance imaging (MRI).
Since the suppressed signal of fat can also account for a
hypointense signal on fat-suppressed T2W images, both
fat-suppressed and non-fat-suppressed T2W images
should be evaluated before classification of a lesion as
hypointense on T2W images.
The signal intensity of tissues on T2W sequences
depends on their relaxation time. The spin of free and
bound protons and water content of tissues affect their
T2 relaxation time. The T2 relaxation time also depends
on the arrangement of macromolecules and local
inhomogeneities in the tissue. Tissues with a long T2
relaxation time show hyperintense signal while those
with short T2 relaxation time show hypointense signal
on T2W images.[1]
A hypointense signal on T2W sequences is the result of
T2 shortening.[1] An increase in local inhomogeneities in
tissue leads to T2 shortening. Paramagnetic materials
such as haemosiderin, gadolinium, free radicals,
and diamagnetic materials such as calcium cause T2
shortening by increasing the local inhomogeneities.[1]
For the same reason, metals (ferromagnetic) also
result in hypointense signal on T2W sequences. The
susceptibility artefact or the blooming artefact produced
by paramagnetic and ferromagnetic substances is
more pronounced on T2 gradient recalled echo (GRE)
sequences than on spin echo sequences. This helps in
better detection of blood products such as haemosiderin.
Most musculoskeletal pathologies such as infections,
tumours and synovitis appear hyperintense or ‘bright’
on T2W sequences. The hyperintense signal is due to
increased perfusion or fluid content. Musculoskeletal
lesions that show low signal intensity on T2W sequences
are less commonly seen in clinical practice and may be
overlooked sometimes by the radiologist. We describe
a few examples of the common T2W hypointense
musculoskeletal lesions arising from the synovium,
bone, and soft tissues in this pictorial essay.
EXAMPLES
T2-weighted Dark Synovial Lesions
Pigmented Villonodular Synovitis
Pigmented villonodular synovitis (PVNS) is an
uncommon benign, hypertrophic process characterised
by villous, nodular and villonodular proliferation of
the synovium with haemosiderin deposition. In the intraarticular form, there is diffuse or focal involvement
of the synovium of the joint while extraarticular PVNS
occurs in a bursa or tendon sheath. Involvement of the
bursa is referred to as pigmented villonodular bursitis or
giant cell tumour of bursa while involvement of the tendon
sheath is known as pigmented villonodular tenosynovitis
or giant cell tumour of the tendon sheath or tenosynovial
giant cell tumour. The knee is the most common site of
intraarticular PVNS and pigmented villonodular bursitis,
while the commonest site of pigmented villonodular
tenosynovitis is the tendon sheath in the hand and foot.
The intraarticular and extraarticular forms are subdivided
into diffuse (23%) and localised (77%).[2]
MRI of intraarticular PVNS reveals diffuse and heterogeneous thickening of the synovium that may
show nodularity.[2] The synovial thickening shows low-to-intermediate signal intensity on all pulse sequences
with multiple low signal intensity foci lining it that show
“blooming” on GRE sequences (Figure 1). The low signal
intensity foci represent haemosiderin. The synovial
thickening shows prominent diffuse enhancement
on post-contrast scans. Associated joint effusion and
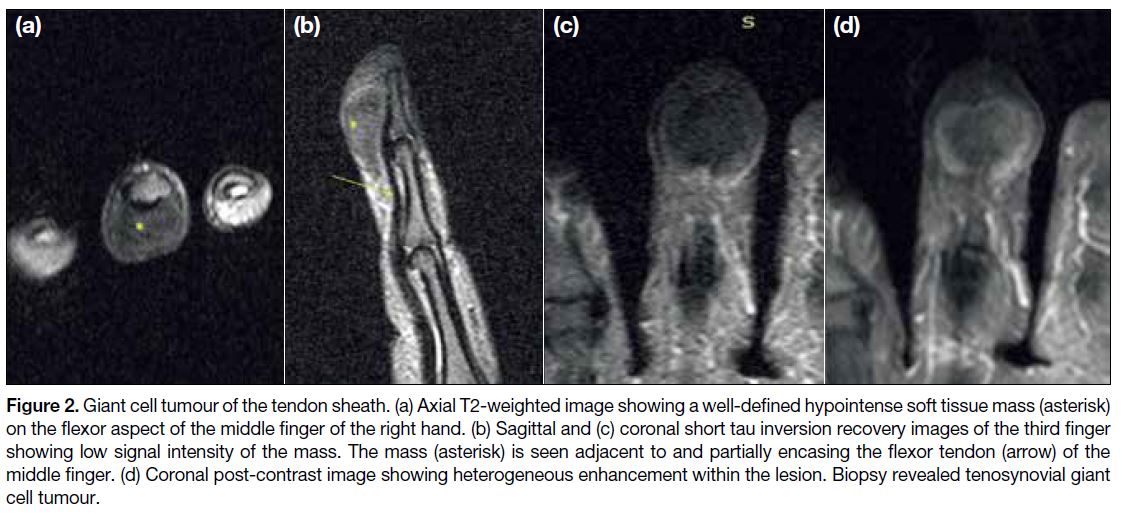
subchondral erosions can also be seen. Giant cell tumour
of the tendon sheath is seen as a well-circumscribed soft
tissue mass in close relationship to the tendon, showing
hypointense signal on both T1-weighted (T1W) and T2W
sequences (Figure 2). Giant cell tumour of the bursa has
a typical bursal location and shows signal characteristics
similar to intraarticular PVNS.
Figure 1. Intraarticular pigmented villonodular synovitis. (a) Sagittal T1-weighted image of the left ankle showing a focal nodular mass
(arrow) involving the synovium of anterior recess of the ankle joint showing hypointense signal intensity. (b) Axial T2-weighted image the
mass (arrow) showing low signal intensity. (c) Sagittal short tau inversion recovery image showing intermediate signal intensity of the mass.
(d) Sagittal post-contrast image showing intense enhancement of the mass. Minimal joint effusion is also noted along the posterior tibiotalar
joint. Biopsy revealed pigmented villonodular synovitis.
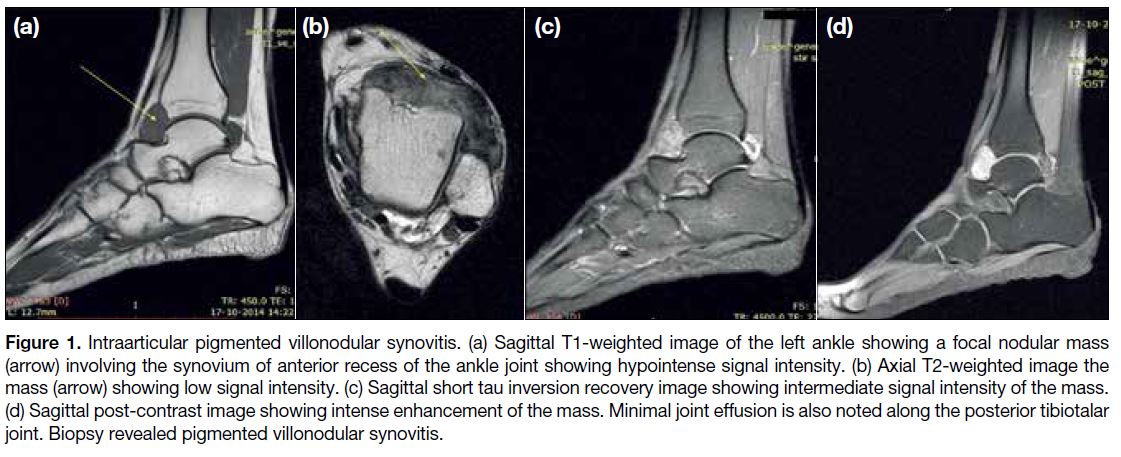
Figure 2. Giant cell tumour of the tendon sheath. (a) Axial T2-weighted image showing a well-defined hypointense soft tissue mass (asterisk)
on the flexor aspect of the middle finger of the right hand. (b) Sagittal and (c) coronal short tau inversion recovery images of the third finger
showing low signal intensity of the mass. The mass (asterisk) is seen adjacent to and partially encasing the flexor tendon (arrow) of the
middle finger. (d) Coronal post-contrast image showing heterogeneous enhancement within the lesion. Biopsy revealed tenosynovial giant
cell tumour.
Synovial Osteochondromatosis
Synovial osteochondromatosis is divided into primary
and secondary forms. The primary form is a rare idiopathic
process characterised by proliferation and metaplasia of
the synovium into osteocartilaginous nodules. These
nodules eventually dissociate from the synovium and
result in multiple intraarticular loose bodies. The knee
joint is the most commonly involved joint.[3] Secondary
synovial chondromatosis is a similar condition but is
associated with underlying joint pathologies. Also, the
osteocartilaginous nodules in the secondary form are
fewer and of variable size and shape contrary to the
primary form where nodules are approximately the same
size and shape.[3]
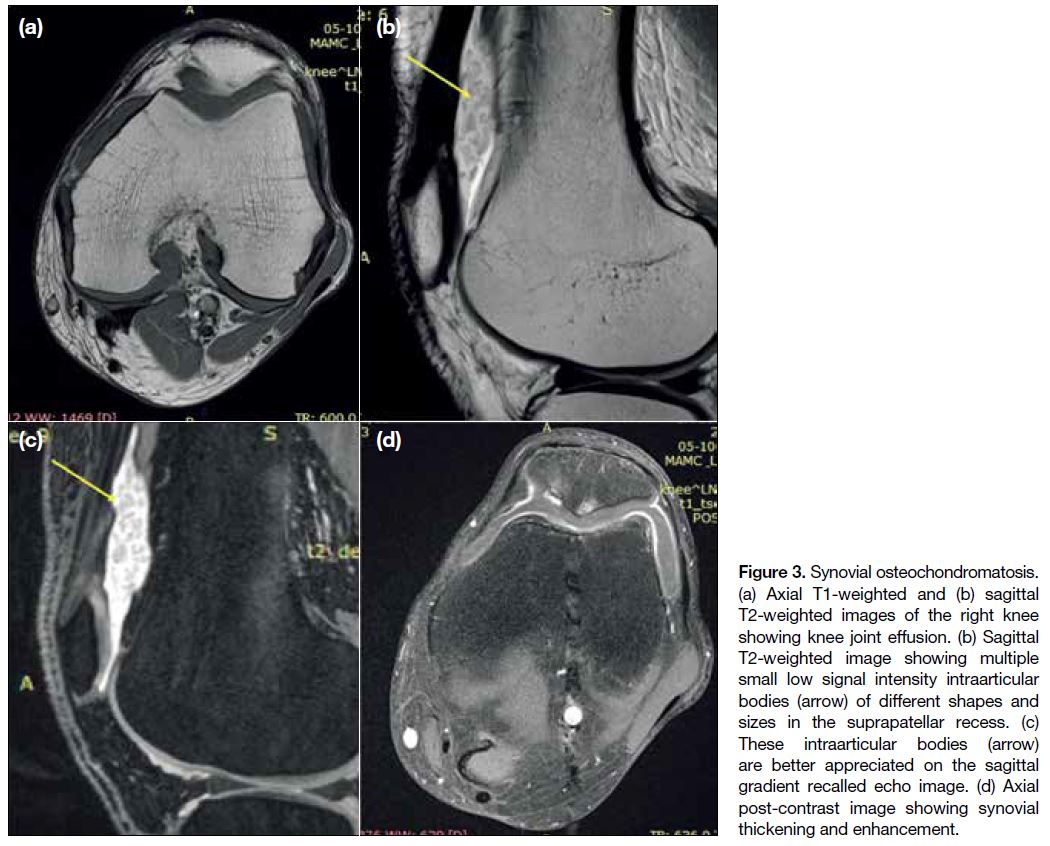
MRI findings depend on the degree of mineralisation
of the cartilaginous nodules. Mineralised cartilaginous
bodies show hypointense signal on T2W images (Figure 3) while nodules having chondroid components
show only a hyperintense signal. Extension of
intraarticular chondromatosis into the bursa can also be
seen. Synovial thickening and bone erosions are other
additional MRI findings.
Figure 3. Synovial osteochondromatosis.
(a) Axial T1-weighted and (b) sagittal
T2-weighted images of the right knee
showing knee joint effusion. (b) Sagittal
T2-weighted image showing multiple
small low signal intensity intraarticular
bodies (arrow) of different shapes and
sizes in the suprapatellar recess. (c)
These intraarticular bodies (arrow)
are better appreciated on the sagittal
gradient recalled echo image. (d) Axial
post-contrast image showing synovial
thickening and enhancement.
Haemophilic Arthropathy
Haemophilia is an X-linked recessive disorder with
deficiency of coagulation factors. Multiple episodes of
bleeding into a joint (haemarthrosis) in patients with
haemophilia lead to haemophilic arthropathy. The
arthropathy is characterised by synovial inflammation
and fibrosis with haemosiderin deposition. There may
be associated erosion of the cartilage or the subchondral
bone. Haemophilic pseudotumour formation can also be
seen in some patients. Pseudotumours are cystic masses
formed in the bones or soft tissues as a result of recurrent
haemorrhage into these structures.
On MRI, the synovium appears diffusely thickened. On
T2W sequences, multiple foci of low signal intensity
lining the synovium are seen that show blooming on GRE
sequences (Figure 4). Other MRI findings in haemophilic
arthropathy include synovial enhancement, joint effusion
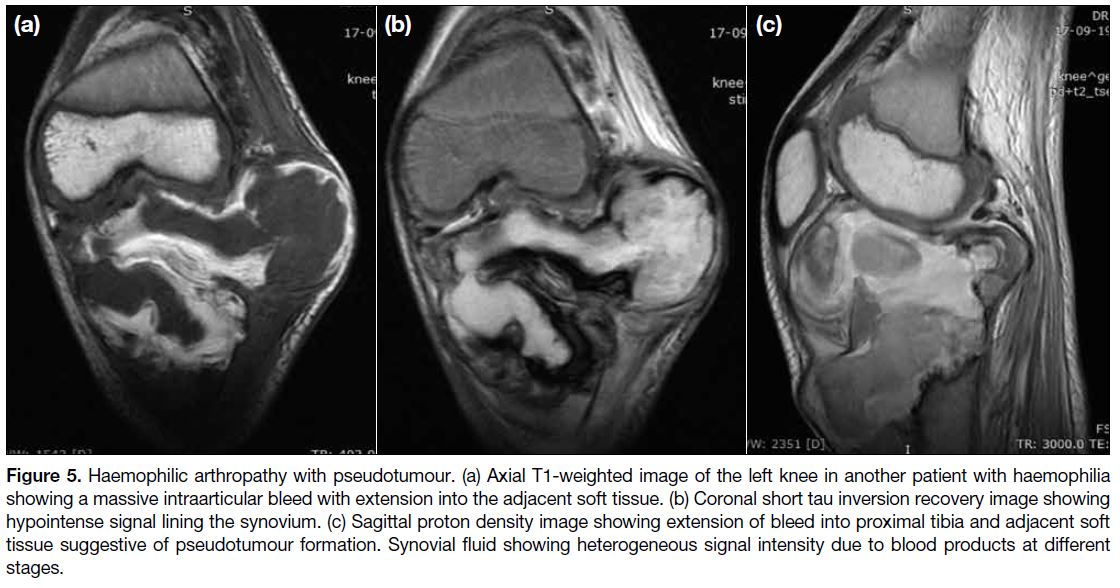
and cartilage erosions. Haemophilic pseudotumours are seen as lesions with fluid components that show
heterogeneous signal intensities (Figure 5). A low signal
peripheral rim may be seen, appearing hypointense on all
sequences. The heterogeneous signal reflects the blood
products in various stages of evolution and the dark
peripheral rim denotes haemosiderin or fibrous capsule.[4]
Figure 4. Haemophilic arthropathy. (a) Coronal T1-weighted image of the left knee in a patient of haemophilia showing hypointense foci
(arrows) lining the synovium secondary to haemosiderin deposition. (b) Axial T2-weighted image showing heterogeneous signal intensity in
the synovial fluid reflecting different stages of haemorrhage. (c) Sagittal T2-weighted gradient recalled echo image showing thickened and
hypointense synovium with clumps of low signal lining and blooming suggestive of haemosiderin deposition. Haemarthrosis is also noted
extending to the suprapatellar bursa and soft tissues.
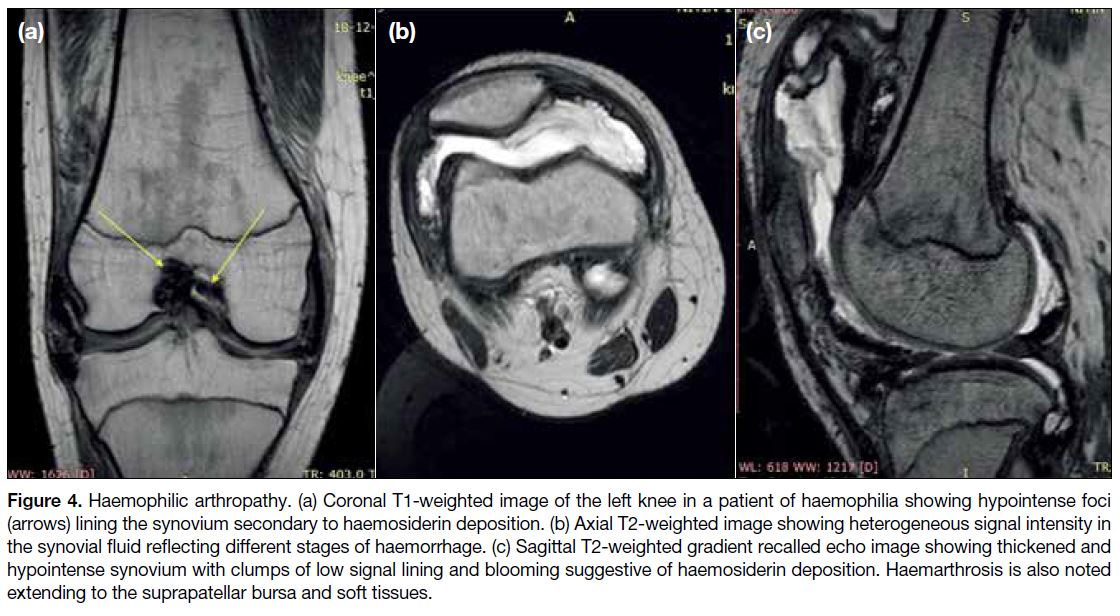
Figure 5. Haemophilic arthropathy with pseudotumour. (a) Axial T1-weighted image of the left knee in another patient with haemophilia
showing a massive intraarticular bleed with extension into the adjacent soft tissue. (b) Coronal short tau inversion recovery image showing
hypointense signal lining the synovium. (c) Sagittal proton density image showing extension of bleed into proximal tibia and adjacent soft
tissue suggestive of pseudotumour formation. Synovial fluid showing heterogeneous signal intensity due to blood products at different
stages.
Rice Bodies
Rice bodies are commonly seen in chronic inflammatory
or infectious arthritis such as rheumatoid arthritis and
tuberculosis. Inflammation in these conditions leads to
synovial hyperplasia with consequent erosions of the
cartilage and subchondral bone. As a result, multiple
small intraarticular loose bodies are formed. These
intraarticular loose bodies resemble grains of rice in
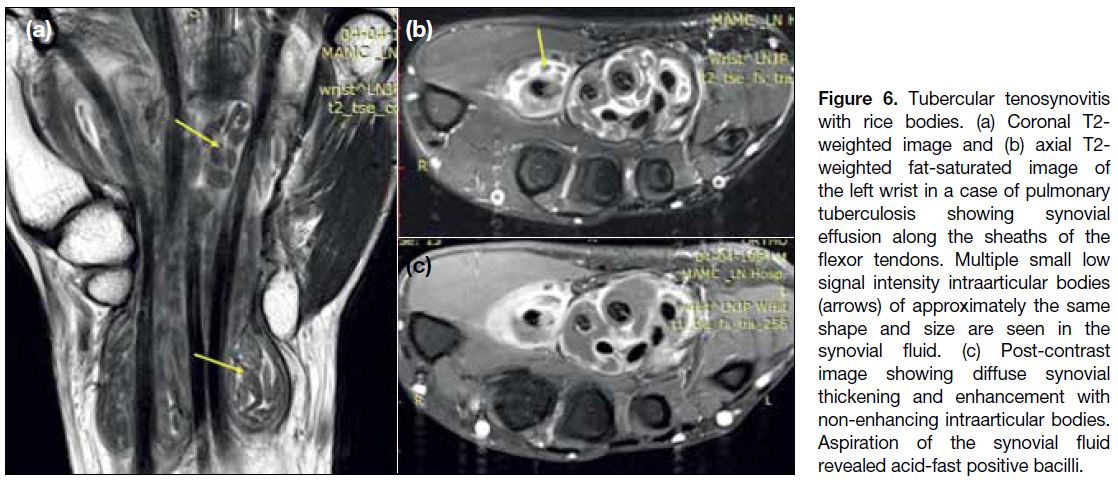
morphology, hence are named rice bodies. On MRI,
rice bodies are seen as numerous T1 and T2 hypointense
intraarticular bodies of approximately the same size and
shape.[5] Joint effusion and synovial thickening showing
vivid post-contrast enhancement can be seen (Figure 6).
Imaging features of underlying pathology such as
tenosynovitis and chondral and subchondral bone
erosions can also be seen.
Figure 6. Tubercular tenosynovitis
with rice bodies. (a) Coronal T2-weighted image and (b) axial T2-weighted fat-saturated image of
the left wrist in a case of pulmonary
tuberculosis showing synovial
effusion along the sheaths of the
flexor tendons. Multiple small low
signal intensity intraarticular bodies
(arrows) of approximately the same
shape and size are seen in the
synovial fluid. (c) Post-contrast
image showing diffuse synovial
thickening and enhancement with
non-enhancing intraarticular bodies.
Aspiration of the synovial fluid
revealed acid-fast positive bacilli.
T2 Dark Soft Tissue Lesions
Fibromatosis
It is a benign condition that includes a spectrum of
fibroblastic and myofibroblastic neoplasms. The lesions
show a strong tendency for local recurrence but never
metastasise.[6] The lesions can have a well-circumscribed
or infiltrative margin. On MRI, they show inhomogeneous
signal on T2W images. Low signal is noted in areas with
abundant collagen content while more cellular areas
show intermediate signal.[6]
Fibromatosis is classified according to its location:
superficial or deep. Superficial fibromatosis includes
palmar, plantar, or infrapatellar fat pad fibromatosis
among which palmar is the most common.[1] MRI in palmar fibromatosis shows nodular or cord-like
structures with signal intensity the same as that of tendons
originating from and running parallel to the palmar
aponeurosis. Enhancement with gadolinium contrast
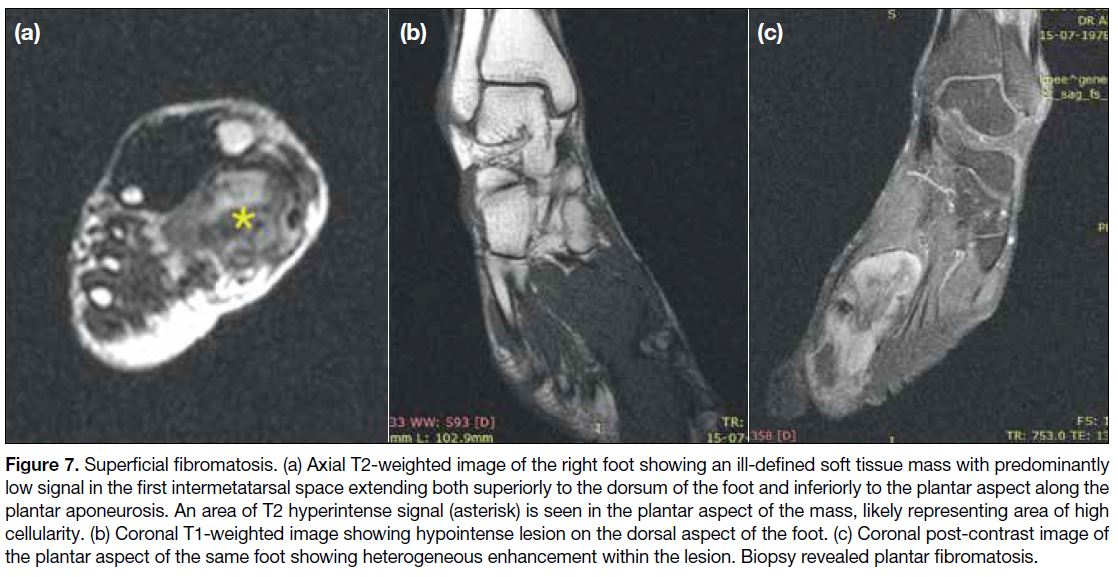
material is variable. Plantar fibromatosis is seen as well-defined
or ill-defined lesions showing intermediate-to-low
signal on T2W images. These lesions are continuous
with plantar aponeurosis and show extension along the
aponeurosis (Figure 7).[1]
Figure 7. Superficial fibromatosis. (a) Axial T2-weighted image of the right foot showing an ill-defined soft tissue mass with predominantly
low signal in the first intermetatarsal space extending both superiorly to the dorsum of the foot and inferiorly to the plantar aspect along the
plantar aponeurosis. An area of T2 hyperintense signal (asterisk) is seen in the plantar aspect of the mass, likely representing area of high
cellularity. (b) Coronal T1-weighted image showing hypointense lesion on the dorsal aspect of the foot. (c) Coronal post-contrast image of
the plantar aspect of the same foot showing heterogeneous enhancement within the lesion. Biopsy revealed plantar fibromatosis.
Deep fibromatosis is also known as desmoid-type
fibromatosis and can be extra-abdominal, intraabdominal
or abdominal wall type. Extra-abdominal desmoids
are mostly located in an intermuscular plane along the
deep fascia and have a predilection for the upper torso.[7]
Intraabdominal fibromatosis is rare and occurs in the
pelvis, mesentery or retroperitoneum.7 Abdominal wall
fibromatosis often arises from the rectus abdominis or
internal oblique muscles and their fascia and usually
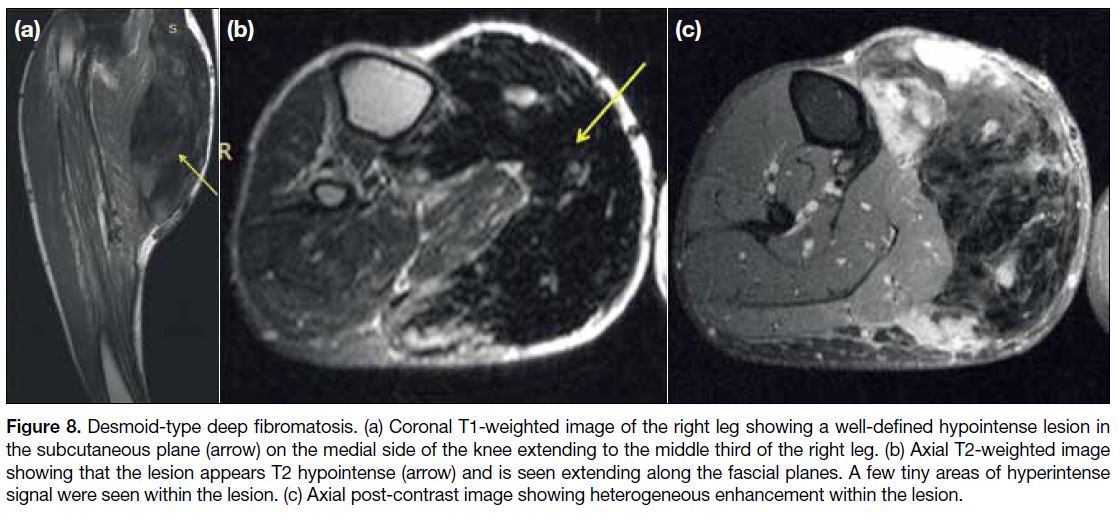
affect women of childbearing age.[7] On MRI, the lesions
of deep fibromatosis show highly variable signal intensity
pattern with the most common being heterogeneous
signal intensity on T2W images (Figure 8).[6]
Figure 8. Desmoid-type deep fibromatosis. (a) Coronal T1-weighted image of the right leg showing a well-defined hypointense lesion in
the subcutaneous plane (arrow) on the medial side of the knee extending to the middle third of the right leg. (b) Axial T2-weighted image
showing that the lesion appears T2 hypointense (arrow) and is seen extending along the fascial planes. A few tiny areas of hyperintense
signal were seen within the lesion. (c) Axial post-contrast image showing heterogeneous enhancement within the lesion.
T2 Dark Bone Lesions
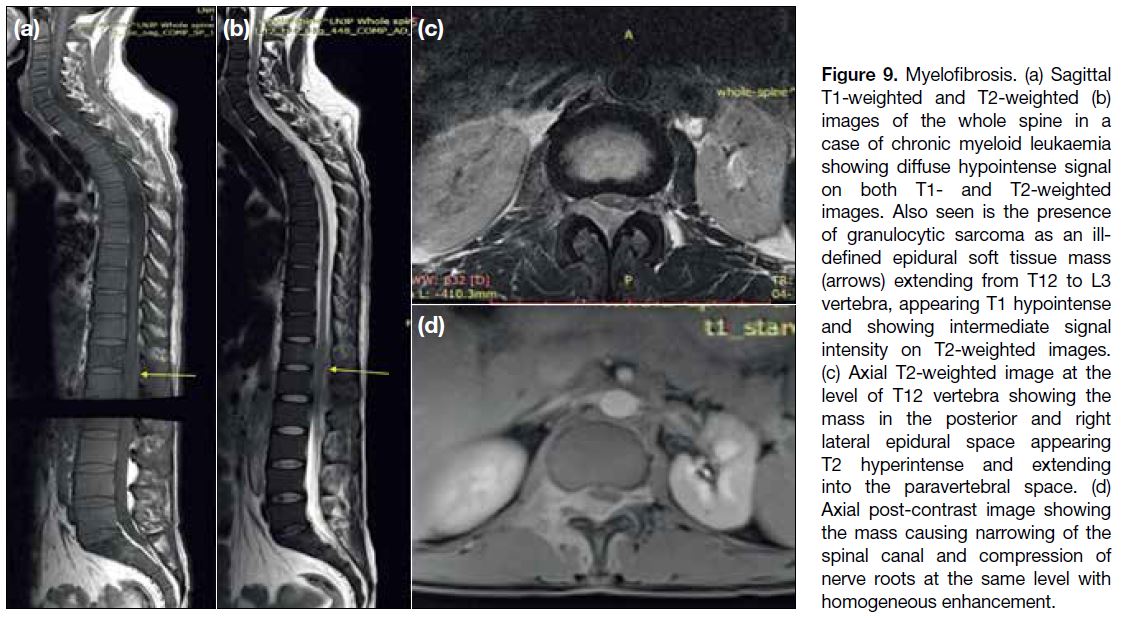
Myelofibrosis
Myelofibrosis is a disorder of the bone marrow in
which there is replacement of the marrow fat by
collagen, reticulin fibres, and cellular material. It can be
primary or secondary to haematological malignancies.
On MRI, the marrow of normal adults appears more
hyperintense on T1W images and isointense or hyperintense on T2W images when compared to the
intervertebral disks. In myelofibrosis, the marrow shows
a homogeneously lower signal than the intervertebral
disks on both T1W and T2W images (Figure 9).[8] Similar
hypointense signal in the marrow can also be seen due
to haemosiderosis, Gaucher’s disease, mastocytosis and
renal osteodystrophy, fluorosis and dysplasias.
Figure 9. Myelofibrosis. (a) Sagittal
T1-weighted and T2-weighted (b)
images of the whole spine in a
case of chronic myeloid leukaemia
showing diffuse hypointense signal
on both T1- and T2-weighted
images. Also seen is the presence
of granulocytic sarcoma as an ill-defined
epidural soft tissue mass
(arrows) extending from T12 to L3
vertebra, appearing T1 hypointense
and showing intermediate signal
intensity on T2-weighted images.
(c) Axial T2-weighted image at the
level of T12 vertebra showing the
mass in the posterior and right
lateral epidural space appearing
T2 hyperintense and extending
into the paravertebral space. (d)
Axial post-contrast image showing
the mass causing narrowing of the
spinal canal and compression of
nerve roots at the same level with
homogeneous enhancement.
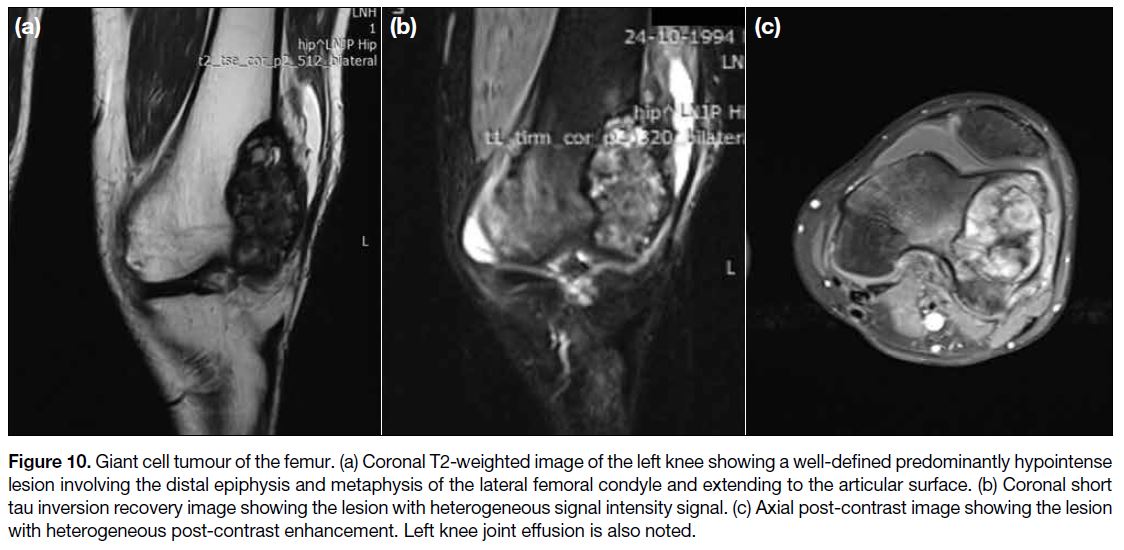
Giant Cell Tumour of Bone
It is a benign but aggressive primary bone neoplasm that typically arises from the metaphysis of long bones and
extends to the epiphysis adjacent to the joint surface.
These tumours show a narrow zone of transition in
between the tumour and the normal bone. On MRI, the
tumour shows hypointense-to-isointense signal on T1W
sequences and heterogeneously high signal with large
areas of low signal intensity within on T2W sequences.
The low signal areas on T2W sequences usually
represent haemosiderin deposition.[9] Post-contrast scans
show heterogeneous enhancement (Figure 10).
Figure 10. Giant cell tumour of the femur. (a) Coronal T2-weighted image of the left knee showing a well-defined predominantly hypointense
lesion involving the distal epiphysis and metaphysis of the lateral femoral condyle and extending to the articular surface. (b) Coronal short
tau inversion recovery image showing the lesion with heterogeneous signal intensity signal. (c) Axial post-contrast image showing the lesion
with heterogeneous post-contrast enhancement. Left knee joint effusion is also noted.
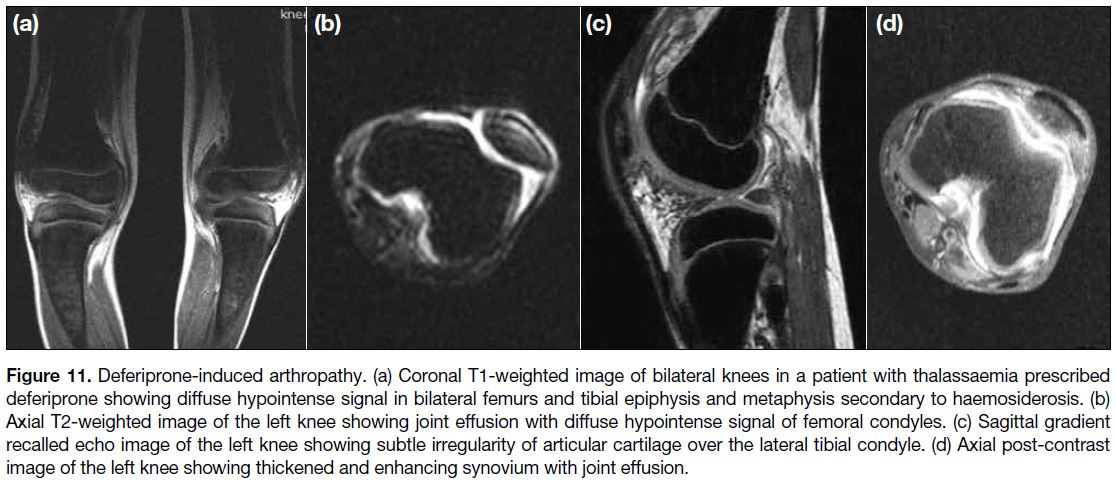
Deferiprone-induced Arthropathy
Deferiprone is an iron chelator used for the treatment
of thalassaemia and other conditions that require
multiple blood transfusions. Arthropathy associated with
deferiprone is hypothesised to be due to the toxic effects
of deferiprone.[10] The MRI findings include hypointense bone marrow on all sequences due to haemosiderosis.
Irregular thickening of cartilage, subchondral erosions,
joint effusion and hypointense bands in the infrapatellar
fat can be seen (Figure 11).[11] Synovial thickening and
enhancement and the presence of synovial bands have
also been reported.[12]
Figure 11. Deferiprone-induced arthropathy. (a) Coronal T1-weighted image of bilateral knees in a patient with thalassaemia prescribed
deferiprone showing diffuse hypointense signal in bilateral femurs and tibial epiphysis and metaphysis secondary to haemosiderosis. (b)
Axial T2-weighted image of the left knee showing joint effusion with diffuse hypointense signal of femoral condyles. (c) Sagittal gradient
recalled echo image of the left knee showing subtle irregularity of articular cartilage over the lateral tibial condyle. (d) Axial post-contrast
image of the left knee showing thickened and enhancing synovium with joint effusion.
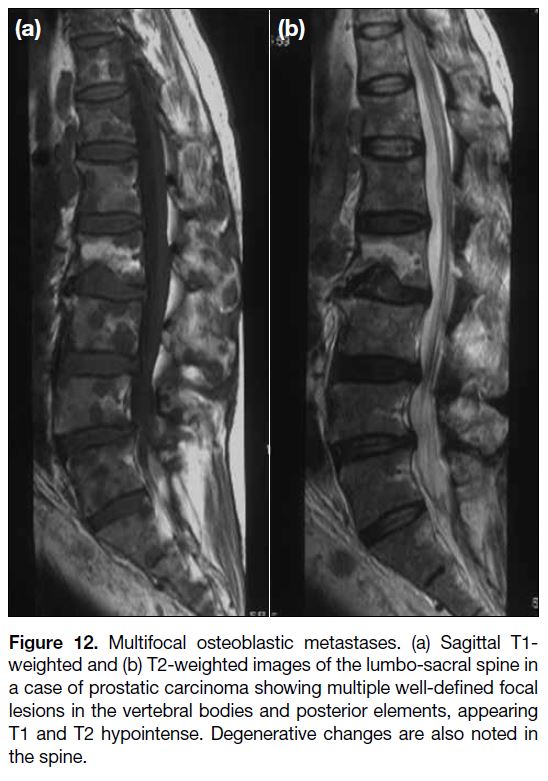
Osteoblastic Metastasis
Osteoblastic or sclerotic bone metastases are characterised
by deposition of new bone. These most frequently arise
from carcinomas of the prostate gland and the breast.
Other primary malignancies resulting in osteoblastic
metastases include mucinous adenocarcinoma of the
gastrointestinal tract, lymphoma, neuroendocrine
tumours, and transitional cell carcinoma. Metastases to
the axial skeleton (especially spine and pelvis) are more
common than to the appendicular skeleton. Diffuse or
multifocal patterns of involvement are more common
than solitary lesions.[1] On MRI, the lesions exhibit
low signal on both T1W and T2W sequences with
enhancement on post-contrast scans (Figure 12).
Figure 12. Multifocal osteoblastic metastases. (a) Sagittal T1-weighted and (b) T2-weighted images of the lumbo-sacral spine in
a case of prostatic carcinoma showing multiple well-defined focal
lesions in the vertebral bodies and posterior elements, appearing
T1 and T2 hypointense. Degenerative changes are also noted in
the spine.
CONCLUSION
A number of musculoskeletal lesions show areas of
low signal intensity on T2W sequences on MRI. The
morphology and location of the lesions along with
systematic analysis of potential underlying low T2W
signal intensity tissue components help narrow the
differential diagnoses.
REFERENCES
1. Papakonstantinou O, Isaac A, Dalili D, Noebauer-Huhmann IM.
T2-weighted hypointense tumors and tumor-like lesions. Semin
Musculoskelet Radiol. 2019;23:58-75. Crossref
2. Murphey MD, Rhee JH, Lewis RB, Fanburg-Smith JC,
Flemming DJ, Walker EA. Pigmented villonodular synovitis:
radiologic-pathologic correlation. Radiographics. 2008;28:1493-518. Crossref
3. Murphey MD, Vidal JA, Fanburg-Smith JC, Gajewski DA. Imaging
of synovial chondromatosis with radiologic-pathologic correlation. Radiographics. 2007;27:1465-88. Crossref
4. Park JS, Ryu KN. Hemophilic pseudotumor involving the
musculoskeletal system: spectrum of radiologic findings. AJR Am J Roentgenol. 2004;183:55-61. Crossref
5. Wadhwa V, Cho G, Moore D, Pezeshk P, Coyner K, Chhabra A.
T2 black lesions on routine knee MRI: differential considerations.
Eur Radiol. 2016;26:2387-99. Crossref
6. Robbin MR, Murphey MD, Temple HT, Kransdorf MJ, Choi JJ.
Imaging of musculoskeletal fibromatosis. Radiographics.
2001;21:585-600. Crossref
7. Walker EA, Petscavage JM, Brian PL, Logie CI, Montini KM,
Murphey MD. Imaging features of superficial and deep fibromatoses
in the adult population. Sarcoma. 2012;2012:215810. Crossref
8. Guermazi A, de Kerviler E, Cazals-Hatem D, Zagdanski AM,
Frija J. Imaging findings in patients with myelofibrosis. Eur Radiol.
1999;9:1366-75. Crossref
9. Aoki J, Tanikawa H, Ishii K, Seo GS, Karakida O, Sone S, et al.
MR findings indicative of hemosiderin in giant-cell tumor of
bone: frequency, cause, and diagnostic significance. AJR Am J
Roentgenol. 1996;166:145-8. Crossref
10. Diav-Citrin O, Koren G. Oral iron chelation with deferiprone.
Pediatr Clin North Am. 1997;44:235-47. Crossref
11. Chand G, Chowdhury V, Manchanda A, Singh S. Deferiprone-induced
arthropathy in thalassemia: MRI findings in a case. Indian
J Radiol Imaging. 2009;19:155-7. Crossref
12. Kellenberger CJ, Schmugge M, Saurenmann T, Di Gennaro L,
Eber SW, Willi UV, et al. Radiographic and MRI features of
deferiprone-related arthropathy of the knees in patients with beta-thalassemia.
AJR Am J Roentgenol. 2004;183:989-94. Crossref