
Common Artifacts in Magnetic Resonance Imaging: A Pictorial Essay
PICTORIAL ESSAY
Common Artifacts in Magnetic Resonance Imaging: A Pictorial Essay
CH Ho1, L Xiao2, KY Kwok1, S Yang1, BWH Fung1, KCH Yu1, WH Chong1, TW Yeung1, A Li1
1 Department of Radiology, Tuen Mun Hospital, Hong Kong
2 Medical Physics Unit, Department of Oncology, Tuen Mun Hospital, Hong Kong
Correspondence: Dr CH Ho, Department of Radiology, Tuen Mun Hospital, Hong Kong. Email: hch1931@ha.org.hk
Submitted: 21 Sep 2021; Accepted: 15 Dec 2021.
Contributors: All authors designed the study. CHH and LX acquired and analysed the data. CHH drafted the manuscript. All authors critically
revised the manuscript for important intellectual content. All authors had full access to the data, contributed to the study, approved the final
version for publication, and take responsibility for its accuracy and integrity.
Conflicts of Interest: All authors have disclosed no conflicts of interest.
Funding/Support: This study received no specific grant from any funding agency in the public, commercial, or not-for-profit sectors.
Data Availability: All data generated or analysed during the present study are available from the corresponding author on reasonable request.
Ethics Approval: This study was approved by New Territories West Cluster Research Ethics Committee of Hospital Authority (Ref No.: NTWC/REC/21064). Informed patient consent was waived by the Committee as this retrospective study involves no additional patient participation and all patient data are anonymised.
INTRODUCTION
Magnetic resonance (MR) imaging provides a non-invasive,
radiation-free mode of imaging. New MR
technologies including MR spectroscopy and functional
imaging provide a novel range of diagnostic information.
With its complexity, diversity and versatility, MR
imaging is one of the most powerful diagnostic tools in a
wide variety of clinical situations.
MR artifacts are common in MR imaging. They are defined
as any signal or void in the images that does not have
an anatomic basis, or that arises as a result of distortion,
addition or deletion of information.[1] MR artifacts can be
related to patient motion, tissue characteristics, imaging
techniques or hardware issues, and may be confused
with genuine pathology or reduce image quality. Some
MR phenomena, which contribute to MR artifacts, are
also exploited for various clinical applications, e.g., out-of-phase imaging and susceptibility-weighted imaging
(SWI). This article provides an overview of common
MR artifacts. It is important for radiologists and MR
technologists to recognise them and be able to minimise
their effects.
COMMON MAGNETIC RESONANCE ARTIFACTS
Truncation Artifact
Truncation artifact, also known as Gibbs, ringing, or
spectral leakage artifact, refers to alternating bright
and dark lines that occur near an abrupt high-contrast
boundary. This artifact is caused by an inadequate number
of encoding steps for high spatial frequency data,[2] which
represent the edge between areas of high contrast. When
there is under-sampling, the highest spatial frequency
data are cut off, leading to the artifact. It can occur in
both frequency- and phase-encoding directions, but is
more common in the latter due to fewer phase-encoding
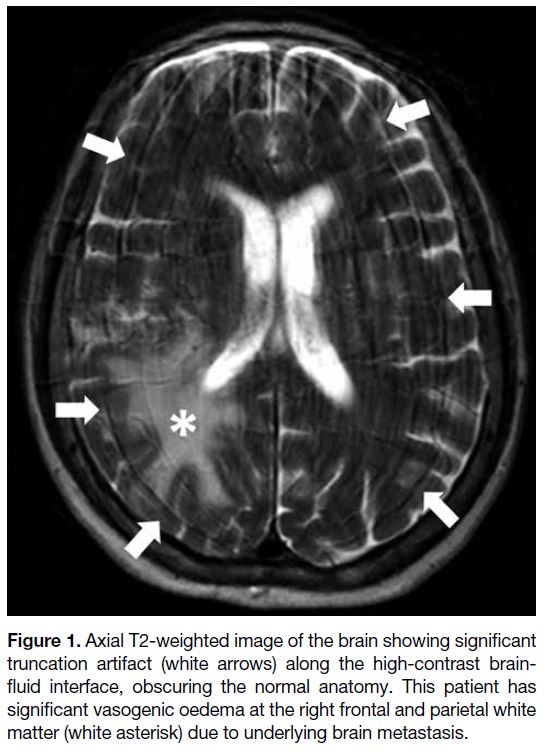
steps in most examinations. It can occur in the brain due
to sharp signal changes between the brain parenchyma
and cerebrospinal fluid (Figure 1). It may also simulate
a syrinx in the spinal cord or a meniscal tear in the knee.
Common remedies include increasing the size of matrix
(more encoding steps) and reducing the field of view
(FOV).[2]
Figure 1. Axial T2-weighted image of the brain showing significant
truncation artifact (white arrows) along the high-contrast brain-fluid
interface, obscuring the normal anatomy. This patient has
significant vasogenic oedema at the right frontal and parietal white
matter (white asterisk) due to underlying brain metastasis.
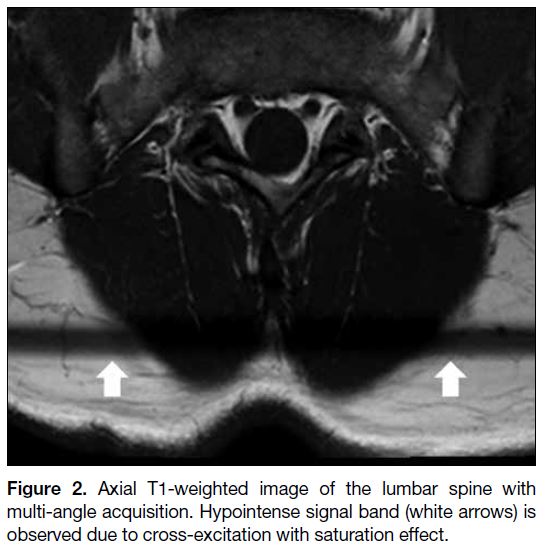
Cross-Excitation Artifact
Cross-excitation artifact is caused by imperfect non-rectangular shape of radiofrequency (RF) excitation
or multi-angle acquisition. As a result, there is some
overlap between adjacent slices during sequential
acquisition. Tissue within the overlapping region is
excited repeatedly during acquisition, causing saturation
effect and decreased signal intensity[3] (Figure 2).
Common remedies include increasing slice gap and
using interleaved slices for acquisition.
Figure 2. Axial T1-weighted image of the lumbar spine with
multi-angle acquisition. Hypointense signal band (white arrows) is
observed due to cross-excitation with saturation effect.
Aliasing
Aliasing occurs when the body part outside the FOV is
projected inside and overlaps on the opposite side of the
image[1] [4] (Figures 3 and 4). It can mask the anatomical
structures in the region of clinical interest. It can occur
in both frequency- and phase-encoding directions but is
generally more severe along the phase-encoding axis.
Figure 3. Axial localiser scan of the abdomen demonstrates aliasing artifact (white arrows). The body part outside the field of view is projected to the opposite side of the image and masks the relevant anatomical structure.
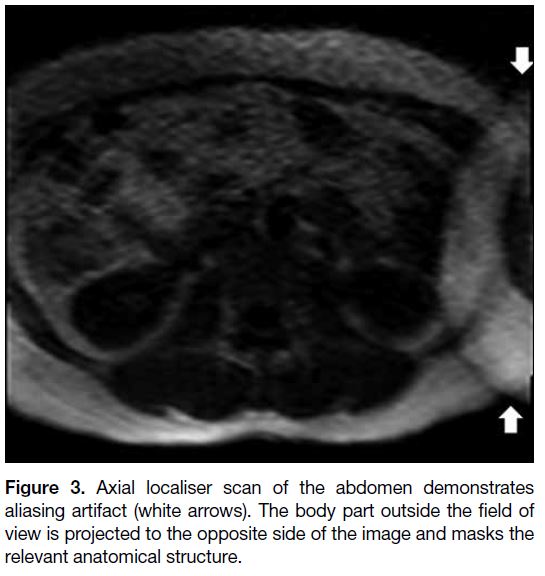
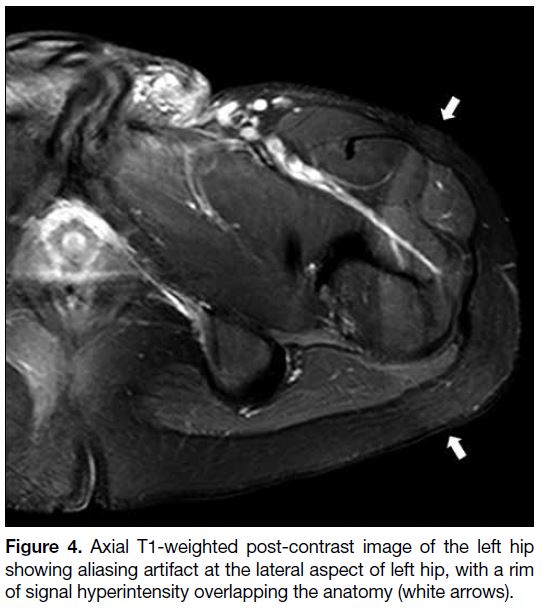
Figure 4. Axial T1-weighted post-contrast image of the left hip showing aliasing artifact at the lateral aspect of left hip, with a rim of signal hyperintensity overlapping the anatomy (white arrows).
During image acquisition, structures outside the
FOV are also excited and produce signals. If the
frequencies of the signals outside the FOV exceed the
Nyquist frequency (the highest frequency that can be
unambiguously sampled), those signals will be falsely
detected as lower frequencies and misregistered, leading
to wraparound phenomenon.[4] [5] For phase-encoding direction, similar ambiguity and misregistration can
result due to its circular nature that repeats every 360°C.[1]
In parallel acquisition techniques, aliasing artifacts have
different appearances and the location of the artifacts
depends on the acceleration factor. Common remedies
include increasing FOV (at the expense of resolution),
oversampling, reducing the acceleration factor, adding
pre-saturation pulses for structures outside the FOV,
using surface coils and switching phase- and frequency-encoding
directions.[4]
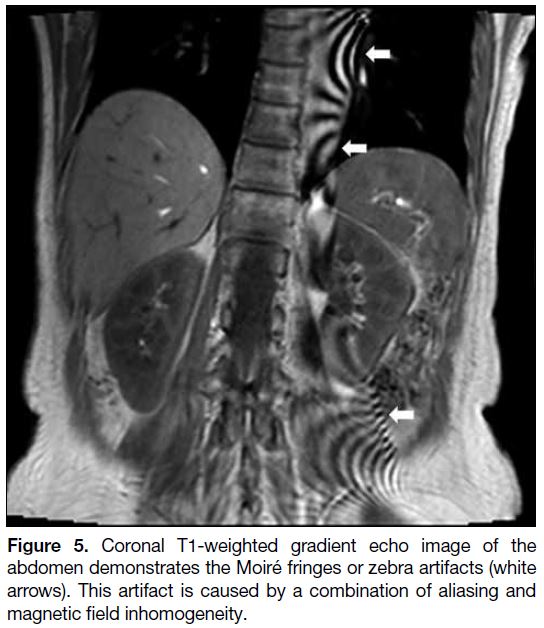
Moiré Artifact
The combination of aliasing artifact and magnetic
field inhomogeneity can cause Moiré fringes or zebra
artifacts.[1] Homogeneity of the magnetic field degrades
towards the edges of the field, especially when the FOV
is large, causing phase differences between the two
edges. When aliasing occurs, the overlapping signals with mismatched phases cause interference patterns
and produce Moiré artifact[1] [5] (Figure 5). This is more
commonly seen in gradient echo imaging with body
coil. Common remedies are similar to those for aliasing
artifact.
Figure 5. Coronal T1-weighted gradient echo image of the abdomen demonstrates the Moiré fringes or zebra artifacts (white arrows). This artifact is caused by a combination of aliasing and magnetic field inhomogeneity.
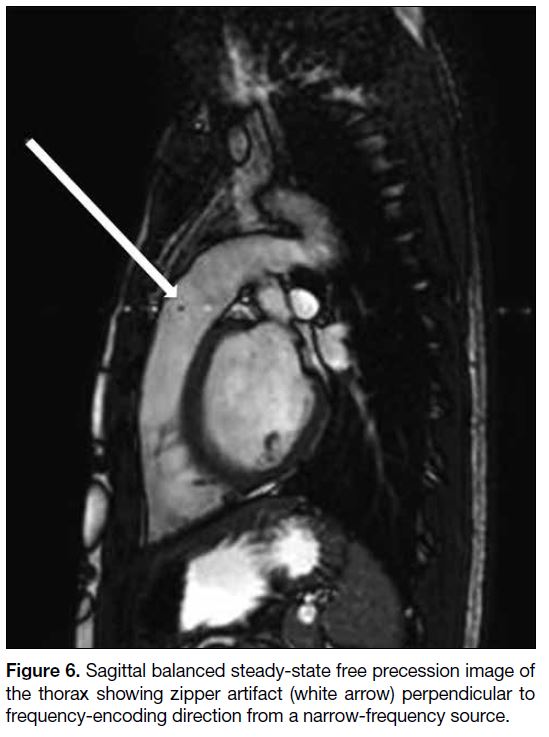
Zipper Artifact
Zipper artifact is most often caused by the interference
of extrinsic RF signals to the MR scanner and is picked
up by the receiver system. The appearance varies with
the frequency and bandwidth of the source. Broadband
source will affect the entire image, while narrow-frequency
source will create discrete bright and dark
broken lines perpendicular to the frequency-encoding
direction[6] (Figure 6). The sources of the extrinsic RF
include electronic devices (e.g., monitoring equipment),
static electricity, opened door and a breach in the RF
shield. Common remedies include removing the external
RF sources, closing the door completely before scanning,
and inspecting thoroughly the scanner room for any
breach of RF shield.[1]
Figure 6. Sagittal balanced steady-state free precession image of the thorax showing zipper artifact (white arrow) perpendicular to frequency-encoding direction from a narrow-frequency source.
Geometric Distortion
Geometric distortion can arise from different sources
and can be hardware-related or tissue-related. The main hardware-related source is gradient field non-linearity
in contemporary MR systems, in which the gradient
strength and slew rate (rate of gradient rise) are much
higher[7] (Figures 7 and 8). Distortions are usually minimal
at the isocentre and more significant at the periphery.
Geometric distortion becomes a clinical concern when
a high level of spatial precision is required, e.g., during
MR-guided interventions or radiotherapy planning.
Different correction algorithms are available from major manufacturers of MR systems to minimise hardware-related geometric distortion.
Figure 7. (a) Phantom image
showing geometric distortion within the slice plane indicated by the curved outline of the phantom image. (b) After the manufacturer’s correction algorithm was applied, the acquisition was repeated and showed significant improvement of the geometric distortion.
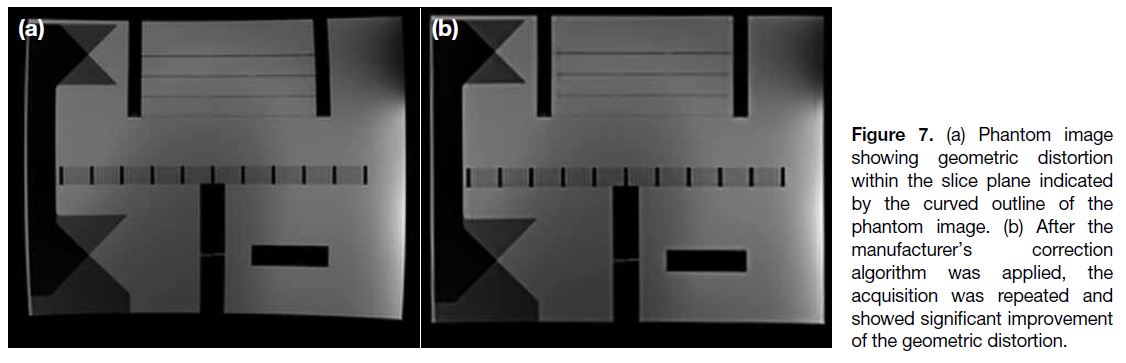
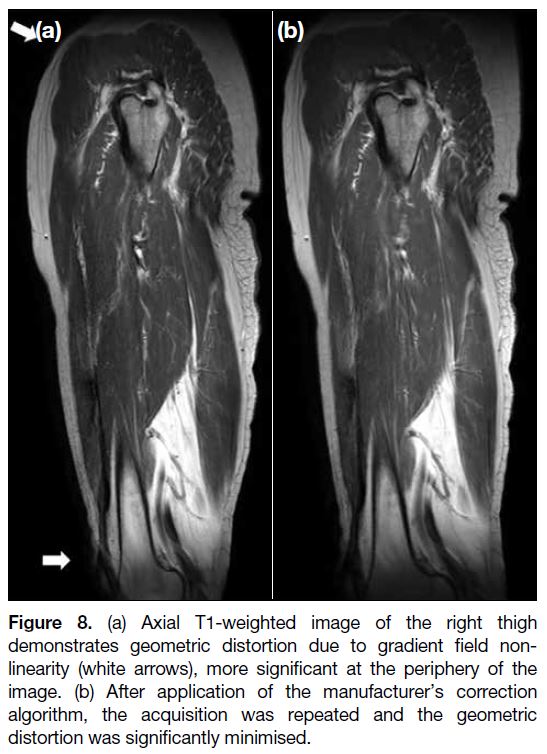
Figure 8. (a) Axial T1-weighted image of the right thigh
demonstrates geometric distortion due to gradient field non-linearity
(white arrows), more significant at the periphery of the
image. (b) After application of the manufacturer’s correction
algorithm, the acquisition was repeated and the geometric
distortion was significantly minimised.
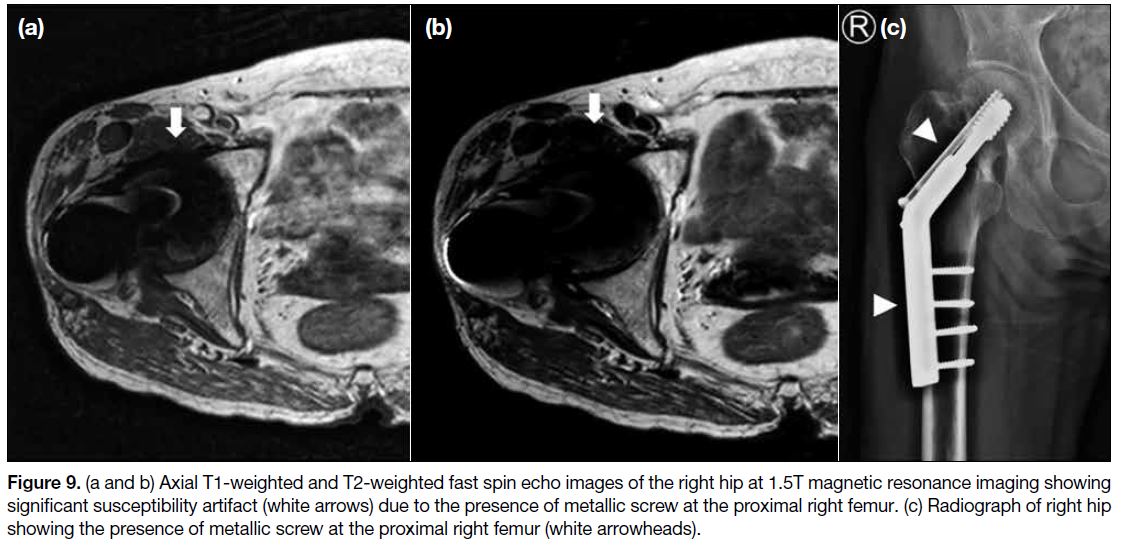
Susceptibility Artifact
Magnetic susceptibility refers to the tendency of a
structure to contribute a magnetic field on its own
under an external magnetic field.[4] This will create local
magnetic field inhomogeneities, altering the frequency
and phase of local spins and also leading to stronger
dephasing of the spins.[8] Severe artifacts can occur near
ferromagnetic objects, e.g., metallic implants and distort
normal anatomy (Figure 9). Such effect can also be found
at the boundary of tissues with different susceptibilities,
for example a tissue-air interface. Increasing field
strength worsens the magnitude of this effect. Common
remedies include using spin echo instead of gradient echo
sequences, orienting the phase-encoding gradient along
the same axis as the susceptibility gradient, reducing echo
time, reducing slice thickness, increasing the acquisition
matrix, improving the local field homogeneity, and
increasing receiver bandwidth.[8]
Figure 9. (a and b) Axial T1-weighted and T2-weighted fast spin echo images of the right hip at 1.5T magnetic resonance imaging showing significant susceptibility artifact (white arrows) due to the presence of metallic screw at the proximal right femur. (c) Radiograph of right hip showing the presence of metallic screw at the proximal right femur (white arrowheads).
The differences in tissue susceptibility can be
exploited in SWI to help diagnose haemorrhage and
calcifications. Both appear hypointense on SWI images.
The filtered phase images of SWI sequences can help
further differentiate paramagnetic (haemorrhage) and
diamagnetic (calcification) products since the latter have
different phases.[9]
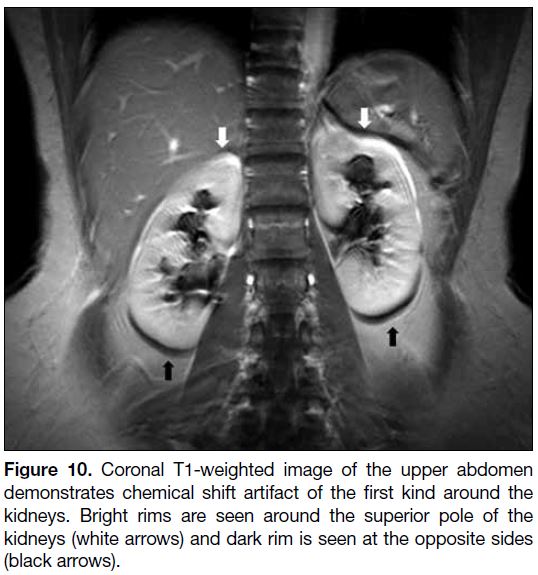
Chemical Shift Artifact
Chemical shift artifact refers to signal alterations that result from inherent differences in the Larmor frequencies
of protons when they are in a different chemical
environment, most frequently observed between water
and fat.[10] It occurs in both spin echo and gradient echo imaging, and along the frequency-encoding direction. It creates signal void as well as superimposition due to the
shifting, and usually manifests as a bright line on one
side and a dark line on the opposite side of the fat-water
interfaces (Figure 10).
Figure 10. Coronal T1-weighted image of the upper abdomen
demonstrates chemical shift artifact of the first kind around the
kidneys. Bright rims are seen around the superior pole of the
kidneys (white arrows) and dark rim is seen at the opposite sides
(black arrows).
The difference is caused by different chemical structures of fat and water. The hydrogen atoms in fat are contained
in a much larger molecule compared with those in water.
As a result, there is a much stronger shielding effect from
the molecule’s electron shell of fat on the static magnetic
field, and the Larmor frequency of the hydrogen atoms
in fat is lowered.[10] The difference in Larmor frequency
is usually expressed as a difference of 3.5 parts per
million relative to the Larmor frequency of water.[11] It is
directly proportional to the main field strength. Common
remedies to chemical shift artifact include using a higher
receiver bandwidth, decreasing FOV and using a fat
suppression technique.
Out-of-Phase Signal Cancellation Artifact
Out-of-phase signal cancellation, or type 2 chemical shift artifact, refers to intravoxel signal cancellation due to
phase difference between the spinning protons in fat and
water. Since the precession of hydrogen atoms in water
and in fat are at different frequencies, they have different
phase directions at different time points and therefore
at certain time points, they can be in-phase or 180°C
out-of-phase. At 1.5T, out-of-phase occurs at 2.2 ms and
in-phase occurs at 4.4 ms. By adjusting the echo time,
both in-phase and out-of-phase images can be produced. At out-of-phase imaging, the signals from protons in
water and fat within the same pixel are cancelled out,
leading to the appearance of a dark band at the fat-water
interface. Unlike chemical shift artifact of the first kind
that can be seen in both spin echo and gradient echo
imaging, this artifact occurs only in gradient echo
sequences since the 180°C rephrasing RF pulse in
spin echo imaging will compensate this phase shift.[11]
Moreover, type 2 chemical shift artifacts can be seen
in all pixels along a fat-water interface, unlike chemical shift artifact of the first kind that is limited to the
frequency-encoding direction.
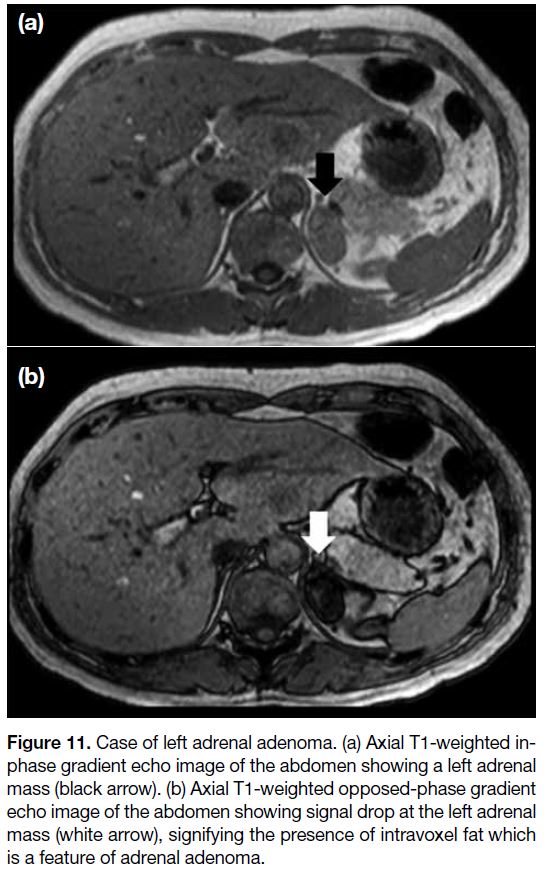
The out-of-phase signal cancellation effect is valuable
for diagnostic purposes. A drop in signal intensity at
out-of-phase images indicates the presence of fat within
the voxel. This is helpful for diagnosing fat-containing
lesions e.g., adrenal adenoma or renal angiomyolipoma
(Figure 11).
Figure 11. Case of left adrenal adenoma. (a) Axial T1-weighted in-phase
gradient echo image of the abdomen showing a left adrenal
mass (black arrow). (b) Axial T1-weighted opposed-phase gradient
echo image of the abdomen showing signal drop at the left adrenal
mass (white arrow), signifying the presence of intravoxel fat which
is a feature of adrenal adenoma.
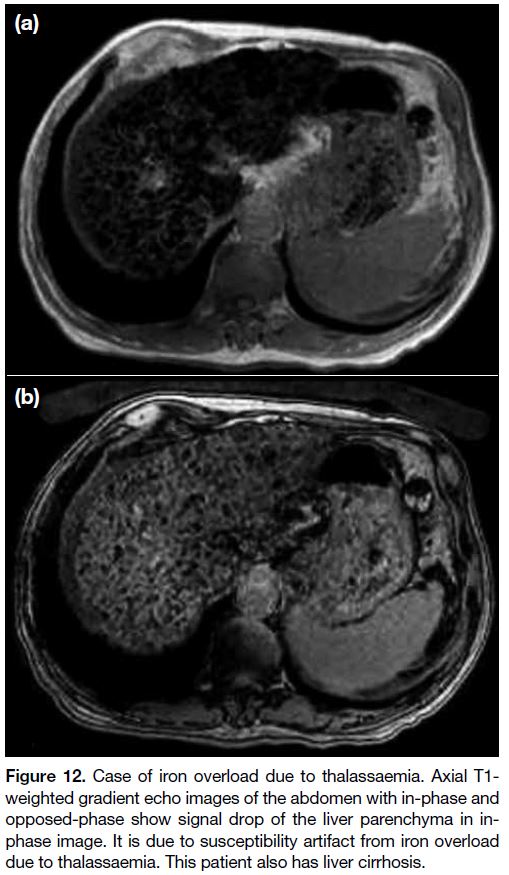
Another added benefit of this dual gradient echo
imaging is to assess signal loss related to magnetic
susceptibility effect. Magnetic susceptibility causes
signal intensity loss with time, therefore more signal loss
occurs in in-phase images with longer echo time than
out-of-phase images. This is helpful when diagnosing
iron deposition, haemorrhage and siderotic hepatic
nodules, etc[11] (Figure 12).
Figure 12. Case of iron overload due to thalassaemia. Axial T1-weighted gradient echo images of the abdomen with in-phase and
opposed-phase show signal drop of the liver parenchyma in in-phase
image. It is due to susceptibility artifact from iron overload
due to thalassaemia. This patient also has liver cirrhosis.
Motion Artifact
Motion artifact is the principal source of artifact in MR imaging, primarily due to the prolonged time required
for most MR imaging sequences. It can be briefly
classified as periodic (e.g., pulsation of blood vessels)
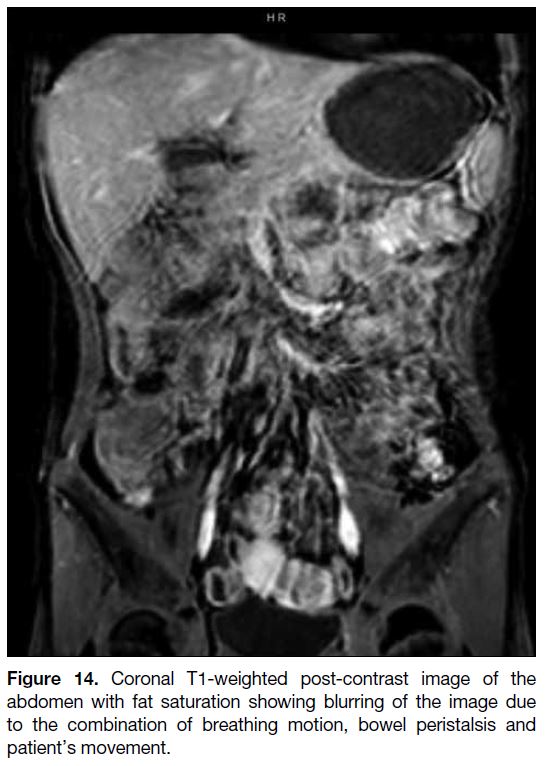
or random (e.g., bowel peristalsis) [Figures 13 and 14].
Random motion generally creates a blurring of images
while periodic motion produces ghost images.[1] Motion
artifact is usually most apparent in the phase-encoding
direction due to the much slower sampling time.
Figure 13. Axial T1-weighted post-contrast image of the knee with fat saturation showing ghosting artifact of the popliteal artery along the phase-encoding direction due to pulsation.
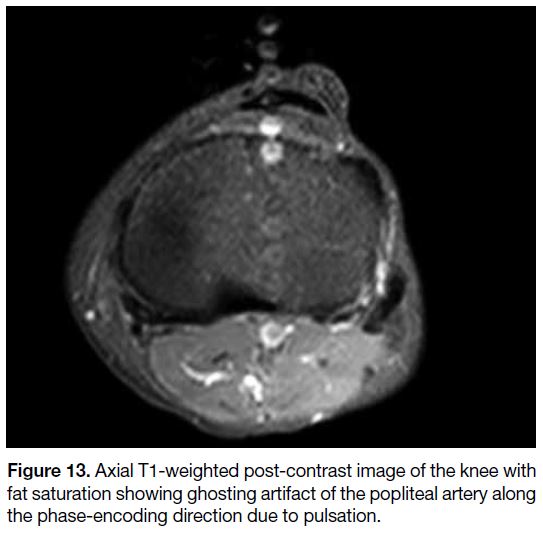
Figure 14. Coronal T1-weighted post-contrast image of the
abdomen with fat saturation showing blurring of the image due
to the combination of breathing motion, bowel peristalsis and
patient’s movement.
Recent advances have improved the situation in some
cases, for example breakthrough in parallel imaging
enables faster imaging that decreases the chance of
involuntary patient motion. Nonetheless improvement in
resolution and signal-to-noise ratio will also increase the
sensitivity to motion.[12]
There are different remedies to reduce motion artifacts,
including motion reduction (e.g., physical immobilisation
or sedation), rapid imaging sequences (e.g., parallel
imaging, triggering and gating for periodic movements,
such as respiratory or cardiac movements), and motion
artifact reduction sequences (e.g., the PROPELLER
[periodically rotated overlapping parallel lines with
enhanced reconstruction] technique).[12]
Coil-Related Artifact
Signal intensity artifact can result from improper coil
or patient positioning and manifests as areas of signal
intensity loss (Figure 15). This error is easily corrected
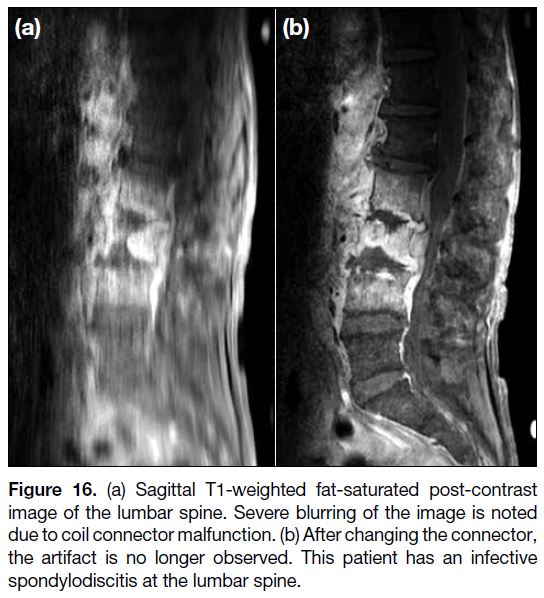
and should be recognised before the more complicated investigations. Other signal intensity artifacts related to
coils include intensity gradient from local coils, local
intensity shift artifact from RF-induced eddy currents,
protocol errors, failure of decoupling mechanisms, and
improper coil tuning[13] (Figure 16).
Figure 15. Axial T1-weighted image of the leg showing focal area
of signal loss at the posterior compartment of the leg. This is due
to suboptimal positioning of the coil.
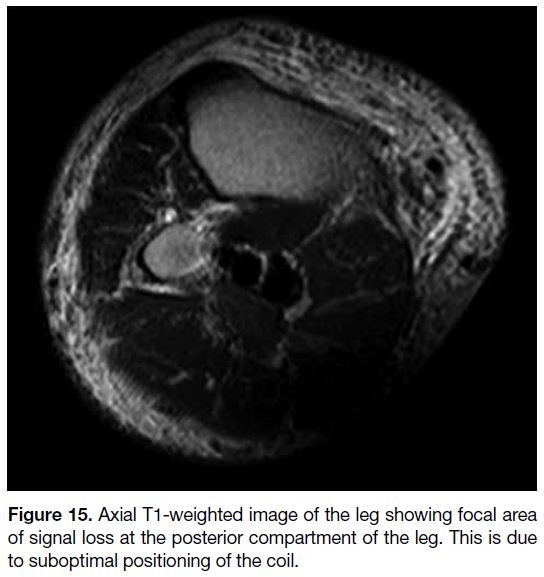
Figure 16. (a) Sagittal T1-weighted fat-saturated post-contrast
image of the lumbar spine. Severe blurring of the image is noted
due to coil connector malfunction. (b) After changing the connector,
the artifact is no longer observed. This patient has an infective
spondylodiscitis at the lumbar spine.
Dielectric Effect
Dielectric effect manifests as abnormal bright and dark
areas due to the interaction of matter with the electric
field. This artifact is mainly found in abdominal and
pelvic imaging at 3T or higher field strength. The
wavelength of RF pulses decreases as the main magnetic
field strength increases. The wavelength at 1.5T is
approximately 52 cm in soft tissue, larger than the size of
most adults. Nonetheless at 3T, the wavelength becomes
approximately 26 cm in soft tissue, similar to the body
torso size of adults. This results in standing wave
effects that lead to areas of constructive and destructive
interference and prevents excitation of the spins at
the centre of imaged volume. Another reason for this artifact is the generation of eddy current from RF pulses,
which is more pronounced at 3T, causing magnetic field
inhomogeneity. The combined effects of standing wave
and eddy current cause focal areas of abnormal signals[14]
(Figure 17).
Figure 17. Axial T2-weighted image of the abdomen showing the
dielectric effect with signal loss at the centre of the abdomen.
Note that this patient has significant ascites that contributes to the
dielectric effect.
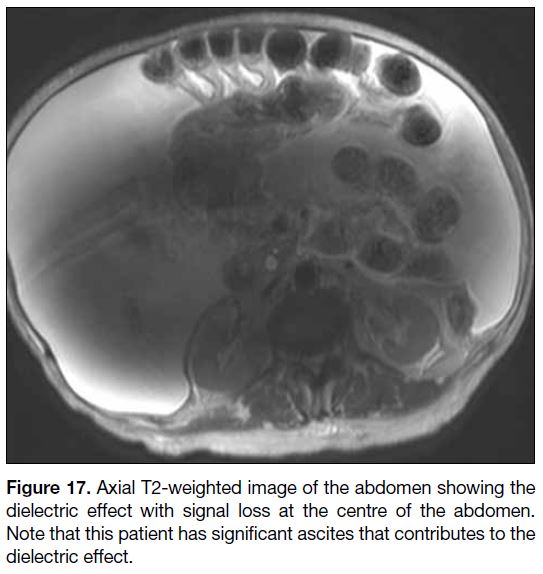
This artifact is accentuated when the imaged structures
are large, e.g., patients with ascites, obesity or pregnancy.
Dielectric effects are variable and difficult to predict, since the shape of the body surface and the conductivity
of the tissue determine the conditions.[15] Common
remedies include placing a dielectric pad and using a
1.5T scanner instead.
CONCLUSION
MR artifacts are common in clinical MR imaging. This
article gives an overview of common MR artifacts
encountered in clinical practice. It is important for
radiologists and MR technologists to recognise the
artifacts and know how to minimise their effects. On
the contrary, some of these MR phenomena can have
clinical applications and help in making diagnosis.
REFERENCES
1. Stadler A, Schima W, Ba-Ssalamah A, Kettenbach J, Eisenhuber E. Artifacts in body MR imaging: their appearance and how to eliminate them. Eur Radiol. 2007;17:1242-55. Crossref
2. Gallagher TA, Nemeth AJ, Hacein-Bey L. An introduction to the Fourier transform: relationship to MRI. AJR Am J Roentgenol. 2008;190:1396-405. Crossref
3. Schwaighofer BW, Yu KK, Mattrey RF. Diagnostic significance of interslice gap and imaging volume in body MR imaging. AJR Am J Roentgenol. 1989;153:629-32. Crossref
4. Morelli JN, Runge VM, Ai F, Attenberger U, Vu L, Schmeets SH, et al. An image-based approach to understanding the physics of MR artifacts. Radiographics. 2011;31:849-66. Crossref
5. Zhuo J, Gullapalli RP. AAPM/RSNA physics tutorial for residents: MR artifacts, safety, and quality control. Radiographics. 2006;26:275-97. Crossref
6. Budrys T, Veikutis V, Lukosevicius S, Gleizniene R, Monastyreckiene E, Kulakiene I. Artifacts in magnetic resonance imaging: how it can really affect diagnostic image quality and
confuse clinical diagnosis? J Vibroengineering. 2018;20:1202-13. Crossref
7. Wang D, Strugnell W, Cowin G, Doddrell DM, Slaughter R. Geometric distortion in clinical MRI systems part I: evaluation using a 3D phantom. Magn Reson Imaging. 2004;22:1211-21. Crossref
8. Stradiotti P, Curti A, Castellazzi G, Zerbi A. Metal-related artifacts
in instrumented spine. Techniques for reducing artifacts in CT and
MRI: state of the art. Eur Spine J. 2009;18 Suppl 1:102-8. Crossref
9. Haacke EM, Mittal S, Wu Z, Neelavalli J, Cheng YC. Susceptibility-weighted
imaging: technical aspects and clinical applications, part
1. AJNR Am J Neuroradiol. 2009;30:19-30. Crossref
10. Hood MN, Ho VB, Smirniotopoulos JG, Szumowski J. Chemical shift: the artifact and clinical tool revisited. Radiographics. 1999;19:357-71. Crossref
11. Shetty AS, Sipe AL, Zulfiqar M, Tsai R, Raptis DA, Raptis CA, et al. In-phase and opposed-phase imaging: applications of chemical shift and magnetic susceptibility in the chest and abdomen. Radiographics. 2019;39:115-35. Crossref
12. Zaitsev M, Maclaren J, Herbst M. Motion artifacts in MRI: a complex problem with many partial solutions. J Magn Reson Imaging. 2015;42:887-901. Crossref
13. Jones RW, Witte RJ. Signal intensity artifacts in clinical MR imaging. Radiographics. 2000;20:893-901. Crossref
14. Huang SY, Seethamraju RT, Patel P, Hahn PF, Kirsch JE, Guimaraes AR. Body MR imaging: artifacts, k-space, and solutions. Radiographics. 2015;35:1439-60. Crossref
15. Schick F. Whole-body MRI at high field: technical limits and clinical potential. Eur Radiol. 2005;15:946-59. Crossref