
Diagnostic Accuracy of 18F-Fluorodeoxyglucose Positron Emission Tomography/Computed Tomography in Preoperative Mediastinal/Extramediastinal Nodal Staging of Non–Small-Cell Lung Carcinoma
ORIGINAL ARTICLE CME
Diagnostic Accuracy of 18F-Fluorodeoxyglucose Positron Emission Tomography/Computed Tomography in Preoperative Mediastinal/Extramediastinal Nodal Staging of Non–Small-Cell Lung Carcinoma
KS Ng, KK Ng, KS Chu, BT Kung, TK Au Yong
Nuclear Medicine Unit and Clinical PET Centre, Queen Elizabeth Hospital, Hong Kong
Correspondence: Dr KS Ng, Nuclear Medicine Unit and Clinical PET Centre, Queen Elizabeth Hospital, Hong Kong. Email: nks176@ha.org.hk
Submitted: 18 Nov 2021; Accepted: 1 Apr 2022.
Contributors: All authors designed the study, acquired the data, analysed the data, drafted the manuscript, and critically revised the manuscript for important intellectual content. All authors had full access to the data, contributed to the study, approved the final version for publication, and take responsibility for its accuracy and integrity.
Conflicts of Interest: As editors of the journal, KSN and TKAY were not involved in the peer review process. Other authors have disclosed no conflicts of interest.
Funding/Support: This research received no specific grant from any funding agency in the public, commercial, or not-for-profit sectors.
Data Availability: All data generated or analysed during the present study are available from the corresponding author on reasonable request.
Ethics Approval: This study was approved by the Research Ethics Committee (Kowloon Central/Kowloon East Cluster) of Hospital Authority, Hong Kong (Ref No.: KC/KE-19-0048-ER-4). Informed consent was waived because of the retrospective nature of the study.
Abstract
Introduction
Lung cancer has the highest incidence and mortality among malignancies in many countries.
18F-Fluorodeoxyglucose (18F-FDG) positron emission tomography/computed tomography (PET/CT) is commonly
indicated for the preoperative nodal staging of non–small-cell lung carcinoma. While maximum standardised
uptake value (SUVmax), visual scoring systems and nodal diameter have been proposed to distinguish benign from
malignant nodes, studies comparing the different measurements have been limited. Correct nodal staging is crucial
in determining if treatment intent is curative or palliative. This study aimed to evaluate the accuracies of nodal
staging in 18F-FDG PET/CT based on different methods.
Methods
A total of 467 mediastinal/extramediastinal lymph nodes from 97 patients, who underwent staging
18F-FDG PET/CT at our centre for non–small-cell lung carcinoma, were retrospectively reviewed. The nodes were
evaluated based on SUVmax, five-point visual interpretation score, and diameter. Their sensitivities, specificities
and accuracies were compared with histology using receiver operating characteristics curves and areas under the
curves (AUCs). Subgroup analyses based on T staging, histology, epidermal growth factor receptor (EGFR) status,
lymph node locations, and tumour SUVmax were also investigated.
Results
The diagnostic performance of visual score (at optimal cut-off of 3) yielded the highest specificity (0.932),
accuracy (0.916), positive predictive value (0.623), and negative predictive value (0.972), results of which were
similar to SUVmax of 2.5 and better than nodal diameter of 10 mm. Subgroup analyses showed that visual interpretation
achieved satisfactory AUCs in different T stages, histologies, EGFR statuses, locations of lymph nodes, and tumour SUVsmax.
Conclusion
The five-point visual interpretation is a convenient diagnostic tool with performance better than nodal
diameter, and similar to that of SUVmax.
Key Words: Carcinoma, non–small-cell lung; Fluorodeoxyglucose F18; Lung neoplasms; Mediastinum; Positron
emission tomography computed tomography
中文摘要
18F-氟脫氧葡萄糖正電子/電腦斷層掃描在非小細胞肺癌術前縱隔/縱隔外淋巴結分期中的診斷準確性
吳國勝、吳官橋、朱競新、龔本霆、歐陽定勤
簡介
肺癌在許多國家的惡性腫瘤中發病率和死亡率最高。18F-氟脫氧葡萄糖(18F-FDG)正電子發射斷層掃描/計算機斷層掃描(PET/CT)通常用於非小細胞肺癌的術前淋巴結分期。雖然已提出最大標準化攝取值(SUVmax)、視覺評分系統和淋巴結直徑來區分良性和惡性淋巴結,但比較不同測量值的研究不多。正確的淋巴結分期對於確定治療目的是治愈性還是姑息性至關重要。本研究旨在評估基於不同方法的18F-FDG PET/CT淋巴結分期的準確性。
方法
本研究回顧性分析在本中心進行18F-FDG PET/CT分期的非小細胞肺癌患者97例共467個縱隔/縱隔外淋巴結。淋巴結根據SUVmax、五級視覺判讀分數和直徑進行評估。我們使用接受者操作特徵曲線和曲線下面積(AUC)將它們的敏感性、特異性和準確性與組織學比較,並研究基於T分期、組織學、表皮生長因子受體(EGFR)狀態、淋巴結位置和腫瘤SUVmax的亞組分析。
結果
視覺分數(最佳截斷值為3)的診斷性能獲得最高特異性(0.932)、準確性(0.916)、陽性預測值(0.623)及陰性預測值(0.972),結果與SUVmax值2.5的結果相似,以及優於淋巴結直徑10 mm的結果。亞組分析顯示,視覺解釋在不同的T分期、組織學、EGFR狀態、淋巴結位置和腫瘤SUVmax中達到滿意的AUC。
結論
五級視覺判讀是一種方便的診斷工具,性能優於淋巴結直徑,並與SUVmax相似。
INTRODUCTION
In many countries, lung cancer has the highest incidence
and mortality among all malignancies.[1] Mediastinal/extramediastinal nodal status is the most important
factor determining the management of early non–small-cell
lung carcinoma (NSCLC). For N0 or N1 disease,
according to the 7th and 8th editions of American
Joint Committee on Cancer staging,[2] [3] curative surgical
resection can be offered.[4] For N2 (subcarinal or ipsilateral mediastinal metastasis) disease, the usual
treatment is chemoradiotherapy (CRT).[4] Accurate mediastinal nodal staging is critical but challenging.
Whereas mediastinoscopy is the gold standard, this
invasive procedure carries 0.5% life-threatening risks of
major complications including arrhythmia, respiratory
failure, and infection.[5] Although staging with computed
tomography based on nodal diameter is non-invasive,
it has limited accuracy.[6] [7] 18F-fluorodeoxyglucose
(18F-FDG) positron emission tomography/computed
tomography (PET/CT) is useful in NSCLC staging.[8] [9] [10] [11]
Both semiquantitative assessment and qualitative visual
interpretation are recommended for distinguishing
benign from malignant lymph nodes (LNs).[10] [11] [12] [13] [14] In a semiquantitative approach, the maximum standardised
uptake value (SUVmax) is used.[10] [11] [12] Yet, SUVmax depends
on many physiological as well as technical factors, such
as injection time, uptake period, and blood glucose
level.[15] [16] Thus, absolute SUVmax is difficult to compare
between different PET/CT systems or subjects. Studies
have compared the accuracies of simple SUVmax and
visual score generated by different comparisons with the
activity in the aorta and other locations, as well as with
a simple unified windowing technique.[13] [14] We aimed
to evaluate the performance of 18F-FDG PET/CT on
mediastinal/extramediastinal nodal staging of NSCLC
based on SUVmax, visual score, and nodal diameter. The
disparity between radiological and pathological staging
was also reviewed.
METHODS
Case Enrolment
Cases of newly diagnosed lung cancer patients who
underwent whole-body 18F-FDG PET/CT for staging in
our centre at Queen Elizabeth Hospital from 1 January
2016 to 31 December 2016 were retrospectively analysed.
Cases were included only if they had (1) histological evidence of primary NSCLC and (2) histological
mediastinal/extramediastinal LN staging. Cases were
excluded if (1) the time interval between PET/CT and
histological LN examination was >2 months, or (2)
treatment was started before PET/CT.
Technical Aspects
All PET/CT examinations were acquired with a
Discovery 710 (General Electric, Milwaukee [WI],
US) according to the 2010 procedural protocol of
the European Association of Nuclear Medicine
for oncological PET imaging.[17] The mean 18F-FDG
activity administrated was 370 ± 44.4 MBq. After a
mean uptake time of 60 minutes (standard deviation =
6.24), image data were acquired from the skull vertex
to the mid-thighs in 7 to 8 bed positions (3 minutes
per bed position) with mean axial bed coverage of
15.2 cm per bed and 9 sections bed overlap in the
2-dimensional acquisition mode. Reconstruction using
optimisation of ordered subset expectation maximisation
was performed with 4.2 mm section thickness in a
128 × 128 matrix and processed through a standard
filter. Non-contrast CT was acquired for anatomical
correlation and attenuation correction with the following
parameters: 120 mA tube current, 140 kV tube voltage,
0.8 s gantry rotation speed, 0.75 pitch, 0.5 mm section
thickness and 512 × 512 matrix. The mean blood glucose
level was 5.5 mmol/L (standard deviation = 0.91).
Positron Emission Tomography/Computed Tomography Interpretation
This study evaluated the accuracy of staging PET/CT
in the diagnosis of mediastinal/extramediastinal LNs.
A nuclear medicine physician, blinded to the patients’
clinical background and histological results, assessed the
PET/CT images according to the Mountain and Dresler
nodal station scheme[18] with an Advantage Workstation
Volume Viewer 4.7 (General Electric, Milwaukee [WI],
US). If the histologically evaluated LNs were identifiable
on PET/CT, three nodal features were analysed: SUVmax,
visual score (as illustrated below) and diameter (short
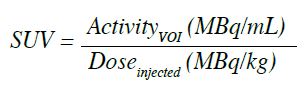
axis in axial plane). SUV is defined as the activity
measured in a volume of interest divided by the injected
18F-FDG dose, based on body weight:
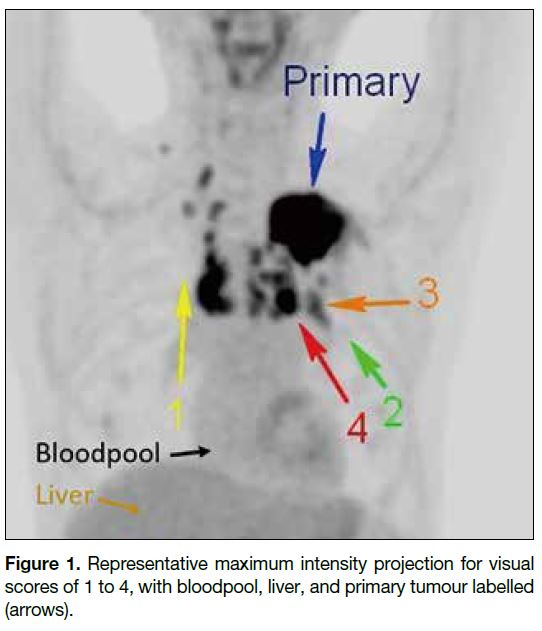
A five-point visual score of LNs was used, with a
standardised lower threshold set at 0 and the upper
threshold at 2 times the liver’s mean standardised uptake value (SUVmean).[14] The LNs were rated based on the
maximum intensity projection image with grey scale
images (Figure 1):
Score 0: No LN uptake
Score 1: LN uptake < mediastinal blood pool
Score 2: mediastinal blood pool ≤ LN uptake < SUVmean of liver
Score 3: SUVmean of liver ≤ LN uptake <2 × SUVmean of liver
Score 4: LN uptake ≥2 × SUVmean of liver
Figure 1. Representative maximum intensity projection for visual scores of 1 to 4, with bloodpool, liver, and primary tumour labelled (arrows).
For primary tumour with uptake similar to that of liver,
the respective LNs were scored 4 if their uptakes were
similar to the uptake of the primary.[14] If a LN was
evaluated histologically but unidentifiable on PET/CT, a
score of 0 was assigned and a 2-cm sphere was marked
as a volume of interest in the corresponding anatomical
location for SUVmax.
Histological Evaluation
Mediastinal/extramediastinal LNs were sampled by
cardiothoracic surgeons or respiratory physicians via
lobectomy (59%), mediastinoscopy (14%), video-assisted
thoracoscopic surgery (11%), endobronchial
ultrasound (8%), pneumonectomy (5%) or wedge
resection (3%). Anatomical staging was evaluated
by pathologists according to Mountain and Dresler
scheme.[18]
Statistical Analysis
Statistical analysis was performed using SPSS (Window
version 20.0; IBM Corp, Armonk [NY], US). Receiver
operating characteristics (ROC) curves as well as
corresponding areas under the curve (AUCs) based
on SUVmax, visual score, and nodal diameter were
compared. The optimal cut-off to distinguish benign
from malignant LNs in PET/CT is the minimum of
√ (1−specificity)² + (1−sensitivity)² . The respective sensitivities, specificities, accuracies, false negative and positive values were determined. Subgroup analyses
were also examined according to primary tumour T
stage (T1-2 vs. T3-4), histology (adenocarcinoma vs.
squamous cell carcinoma), epidermal growth factor
receptor (EGFR) status (wild type vs. mutated), primary
tumour SUVmax (<10 vs. ≥10), and LN location (hilar vs. other mediastinal).
RESULTS
Histology Findings
A total of 467 mediastinal/extramediastinal LNs from
97 patients (62 male, 35 female) of mean age 66 ± 8.4
years were included. The characteristics of the study
population are summarised in Table 1. Adenocarcinoma
was the most commonly reported histological finding.
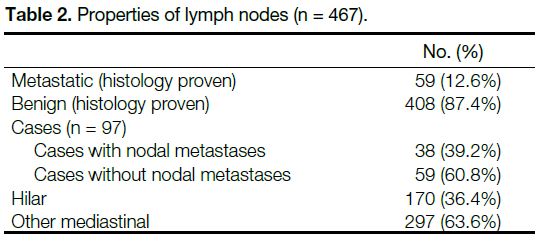
The properties of LNs are outlined in Table 2.
Table 1. Characteristics of the study population (n = 97).
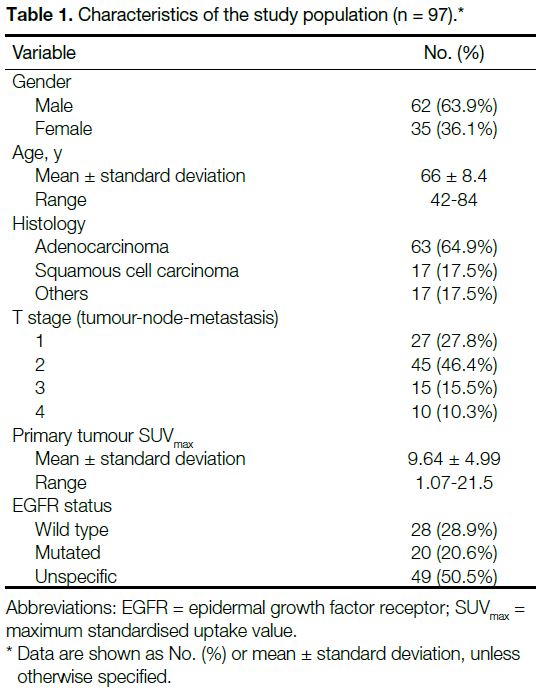
Table 2. Properties of lymph nodes (n = 467).
Positron Emission Tomography/Computed Tomography Performance
Figure 2 shows the ROC curves based on visual score,
SUVmax, and nodal diameter. Their corresponding AUCs
are listed in Table 3. The visual score achieved the
highest AUC of 0.901 (95% confidence interval [CI] = 0.870-0.926), compared with 0.897 (95% CI = 0.866-0.923) for SUVmax and 0.804 (95% CI = 0.737-0.872) for nodal diameter, respectively. Whereas the difference in
AUCs for visual score and SUVmax were not statistically
significant (p = 0.796), their AUCs were significantly
greater than those for nodal diameter (p = 0.0003).
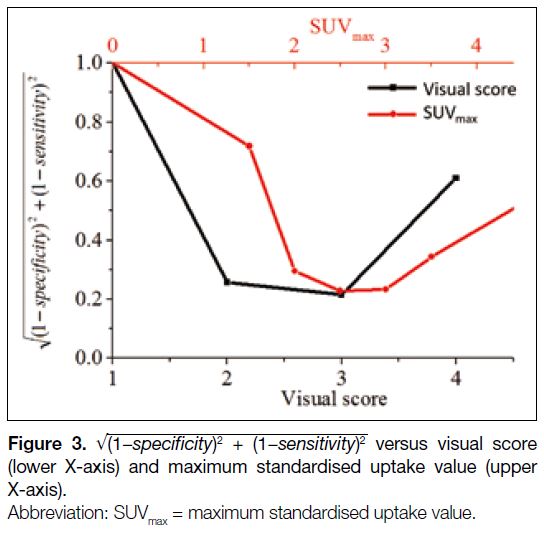
Figure 3 shows
√ (1−specificity)² + (1−sensitivity)²
against visual score (lower X-axis) and SUVmax
(upper X-axis). As mentioned above, the optimal
diagnostic cut-off corresponds to the minimum of
√ (1−specificity)² + (1−sensitivity)²
. The cut-off for
visual score was 3, implying that LNs with uptakes
greater than or equal to that of liver should be suspicious
for metastases. The optimal cut-off for SUVmax was 2.5
as demonstrated in Figure 3. Similar analysis for nodal
diameter (not shown) gave a cut-off of 10 mm.
Figure 2. Receiver operating characteristics curves based on visual score, maximum standardised uptake value, and nodal diameter.
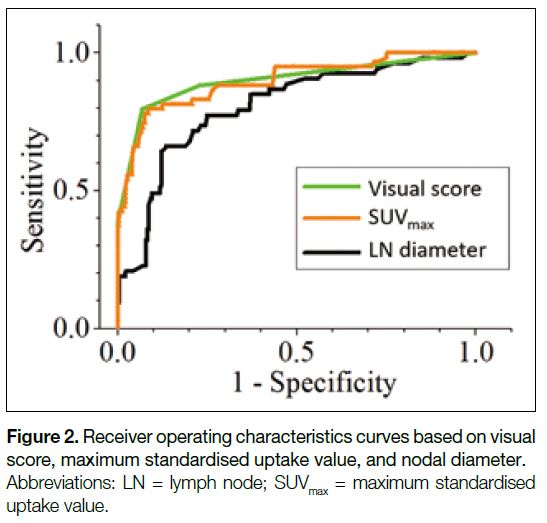
Table 3. Diagnostic performance based on visual score, maximum standardised uptake value, and nodal diameter.
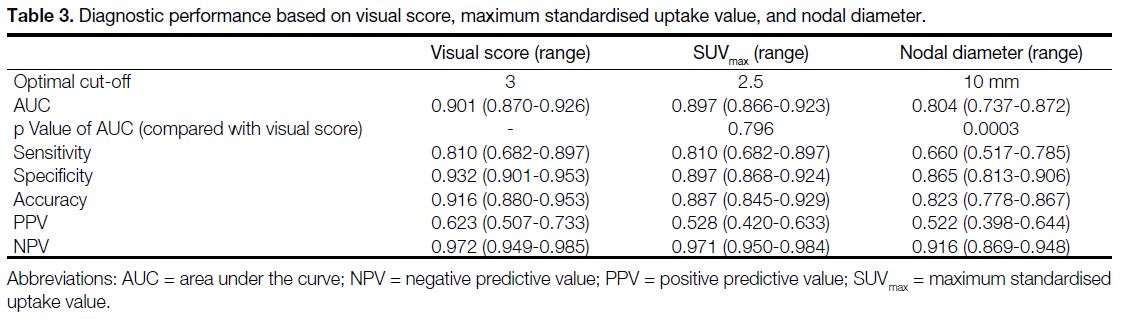
Figure 3. √ (1−specificity)² + (1−sensitivity)²
versus visual score (lower X-axis) and maximum standardised uptake value (upper X-axis).
Based on the cut-offs, the corresponding sensitivities,
specificities, accuracies, positive predictive values
(PPVs) and negative predictive values (NPVs) are
evaluated in Table 3. Among SUVmax, visual score and
nodal diameter, the visual score yielded the highest
specificity (0.932, 95% CI = 0.901-0.953), accuracy
(0.916, 95% CI = 0.880-0.953), PPV (0.623, 95% CI = 0.507-0.733), and NPV (0.972, 95% CI = 0.949-0.985).
They were higher than those based on nodal diameter
(p = 0.0003), although they had no statistically significant
difference from the respective values of SUVmax (p > 0.05). On the other hand, the PET/CT achieved limited
sensitivity based on nodal diameter (0.660, 95% CI = 0.517-0.785).
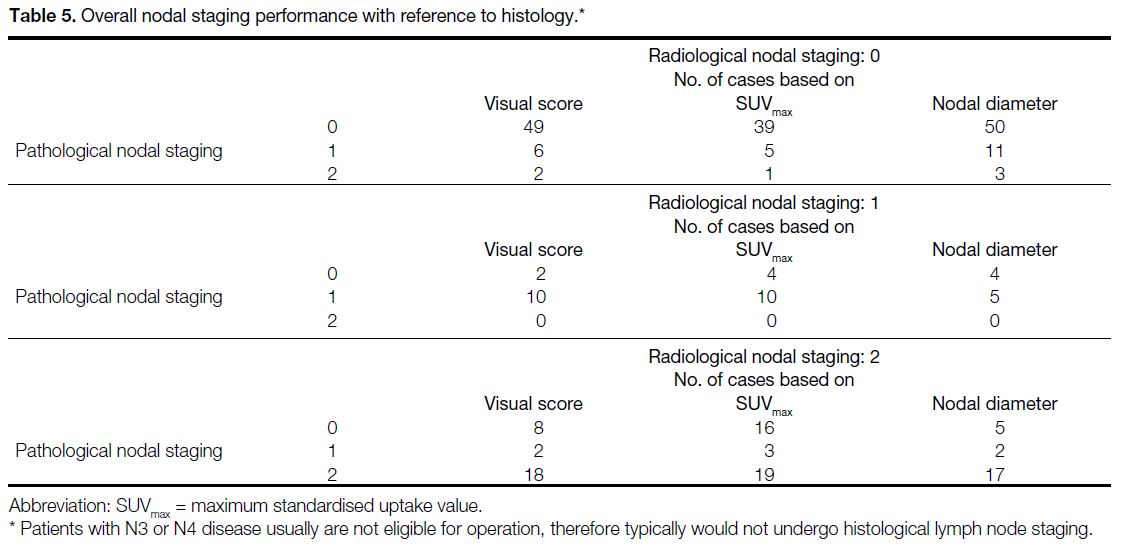
Subject-based staging rates are shown in Table 4. Based on visual interpretation, 77 subjects (79%)
had correct nodal staging by visual score, whereas 12 subjects (12%) were false positive and eight (8%) were
false negative. Based on SUVmax, 68 subjects (70%)
had correct staging with 23 (24%) wrong upstaging
and six (6%) wrong downstaging. Based on
nodal diameter, 72 subjects (74%) had correct staging
with 11 (11%) wrong upstaging and 14 (14%) wrong
downstaging. The overall nodal staging
performance achieved no significant difference between
visual interpretation and nodal diameter in McNemar’s
test (p = 0.190), while that of SUVmax and nodal diameter
had statistical significance (p = 0.001).
Table 4. Overall nodal staging performance with reference to histology
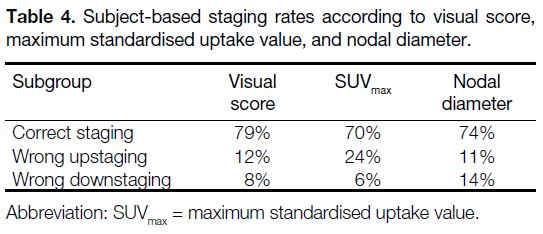
Table 5. Subject-based staging rates according to visual score, maximum standardised uptake value, and nodal diameter.
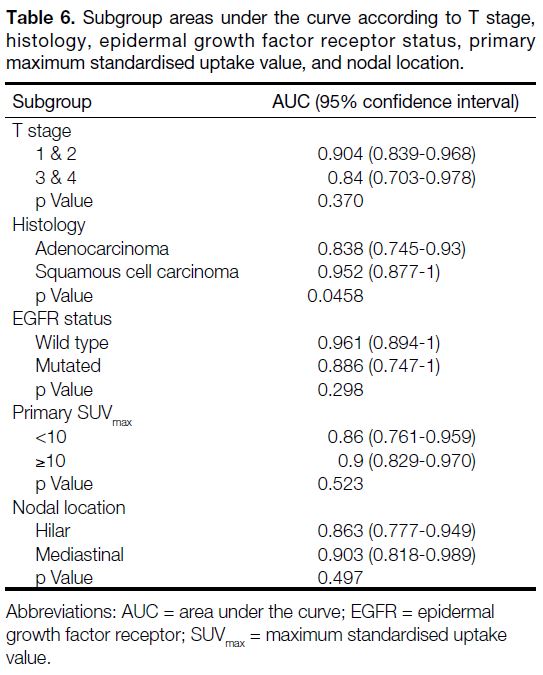
Subgroup Analyses
Figure 4 shows the ROC curves of visual score according
to T stage (T1-2 vs. T3-4), histology (adenocarcinoma vs. squamous cell carcinoma), EGFR status (wild type
vs. mutated), primary tumour SUVmax (<10 vs. ≥10), and
LN location (hilar vs. mediastinal). Their corresponding
AUC values ranged from 0.838 to 0.961 (Table 6). For
all subgroup analyses, the optimal cut-off of visual
score was 3. To assess the significance of the difference
between the AUCs, two-tailed tests were evaluated
within the subgroups. The p values were > 0.05 for all
subgroup analyses, except for histology, which had a p value of 0.0458.
Figure 4. Subgroup receiver operating characteristics curves according to (a) T stage, (b) histology, (c) epidermal growth factor receptor status, (d) maximum standardised uptake value of primary tumour, and (e) lymph node location based on visual score.
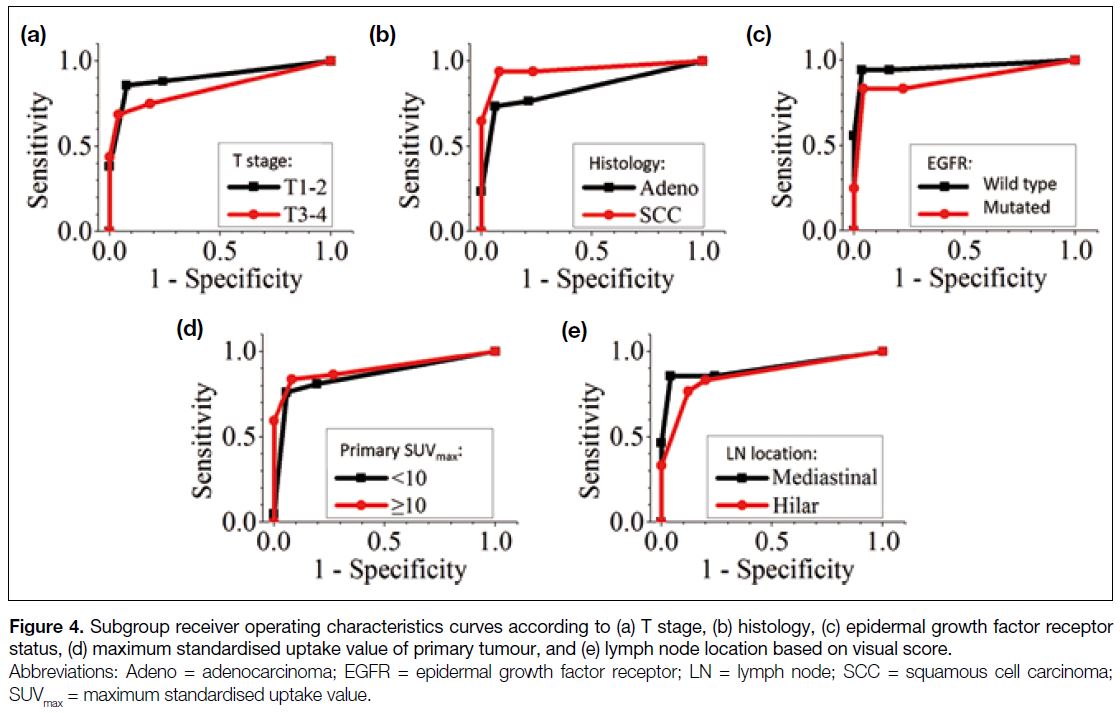
Table 6. Subgroup areas under the curve according to T stage, histology, epidermal growth factor receptor status, primary maximum standardised uptake value, and nodal location.
DISCUSSION
Different radiological criteria have been proposed for
nodal staging in NSCLC, including semiquantitative
SUVmax,[10] [11] qualitative visual interpretation,[13] [14] and nodal
diameter.[6] [7] For visual interpretation, the current study
focused on a five-point system[14] because of its convenient
applicability (with reference to mediastinal blood pool
and liver). We demonstrated good performance of the
visual score. Subgroup analyses showed satisfactory
AUCs in different T stages, histology, EGFR status, LN
locations or primary SUVmax. There were no significant
differences among the subgroups analyses, except for the
histology, which had a borderline p value of 0.0458.
There were limited studies comparing the performance
of visual score with SUVmax or nodal diameter.[13] Our
study suggested that the visual interpretation achieved
satisfactory AUC, specificity, accuracy, and NPVs. Such
performance was statistically significant (p = 0.0003)
compared with that of nodal diameter. While the cut-off
for nodal diameter was 10 mm (axial plane), the smallest
true positive LN identifiable by visual interpretation had
a diameter of 7 mm with a SUVmax of 2.5 (corresponding
primary tumour SUVmax = 11 and liver SUVmean = 1.49).
This example demonstrates the higher sensitivity of
PET/CT to detect small malignant LNs compared with
nodal diameter in CT alone. Although the visual score
resulted in higher specificity, accuracy, PPV and NPV
compared with SUVmax of 2.5, the differences were
not statistically significant. A possible explanation is
the similar cut-off magnitudes. A visual score with a
cut-off of 3 corresponds to the liver’s SUVmean (range,
1.22-3.16). This is close to the SUVmax cut-off of 2.5 and
therefore yields similar performance.
The limited sensitivity of 0.810 in visual interpretation
was reviewed by examining the false negative cases.
Among the eight false negative LNs, three (25%) may
be explained by the limited PET/CT spatial resolution,
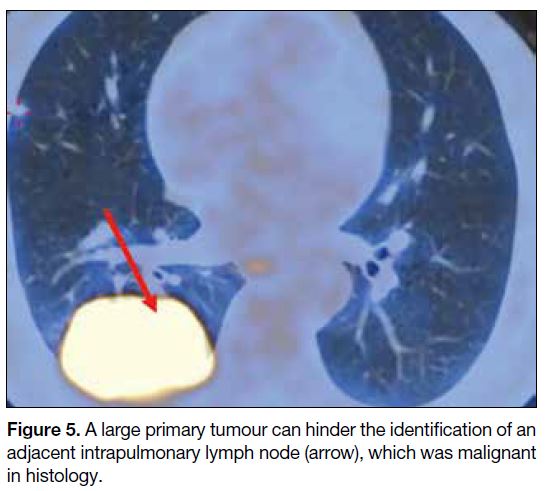
as their pathology findings showed only a few clusters of tumour cells. Two cases (16.7%) may have been
attributable to the close proximity of the primary tumour
and LN. As illustrated in Figure 5, a large primary tumour
limited the visualisation of the nearby intrapulmonary
LN, which was proven to be malignant histologically.
Whereas low 18F-FDG uptake by the primary tumour may
limit the identification of nodal metastases,[19] the 38 cases
with nodal metastases all had 18F-FDG–avid primaries.
The least avid primary tumour with nodal metastasis
had an SUVmax of 3.07, which was still distinguishable
from the liver SUVmean of 2.2. All nine (9.3%) cases with
non–18F-FDG avid primaries had no nodal metastases.
We do not know what was behind the remaining seven
false negative cases (58.3%).
Figure 5. A large primary tumour can hinder the identification of an adjacent intrapulmonary lymph node (arrow), which was malignant in histology.
Nodal staging is crucial for treatment of early-stage
NSCLC.[4] For N1 and N2 disease treated with surgery, the
adjuvant treatment is chemotherapy (N1) and sequential
CRT (N2). For inoperable N2 disease, the primary
treatment is CRT. Of the SUVmax, visual score and nodal
diameter, the visual score achieved the most reliable
overall staging, with an accuracy of 79% (Table 4). If a
patient is mistakenly upstaged to N2 (10% subjects in the
current report), his/her opportunity for curative surgery
may be missed as they may receive CRT. If a patient is
mistakenly downstaged from N2 disease (2% currently),
his/her option for CRT instead of surgery may also be
missed.
The cut-off of visual score in the current study was 3,
implying that the LNs were suspicious for malignancy if
their uptakes were greater than or equal to that of the liver (Figure 3). The identical cut-off of 3 was consistently
observed in subgroup analyses (Figure 4). On the other
hand, the cut-off in a previous study was >3,[14] implying
malignancy if the uptake was >2 times the liver uptake
or as elevated as that of the primary. The discrepancy
of the two cut-offs may be due to different scanners,
acquisition protocols, or reconstruction methods. Indeed,
the same study suggested malignancy for a score of 3 as
it was 3.3 times as likely to be malignant as a LN with a
score of 2.[14]
In our study, the PPV based on visual interpretation
was 0.623, which is less than the approximate value
of 0.75 in the previous report.[14] This discrepancy may
be explained by the fact that the lower the ratio of
histologically malignant/total LNs, the lower the PPV.
This ratio was 0.126 in the current study, which is lower
than 0.194 in the previous report.[14]
The current study was limited by several factors. This
was a retrospective study, thus it had no randomisation,
and it was difficult to control confounders. The cases
were all fit for histological workup and had no evidence
of distant metastases. The study evaluated only 97
subjects and all were Chinese. The SUV depended on
many factors, including scanner mode, acquisition
protocol, and reconstruction method of the PET/CT.
CONCLUSION
PET/CT offers noninvasive preoperative nodal staging
of NSCLC. A convenient visual interpretation is
demonstrated to have diagnostic performance better
than and similar to that of nodal diameter and SUVmax,
respectively. The limited sensitivity can be attributed to
the spatial resolution of PET/CT.
REFERENCES
1. Bray F, Ferlay J, Soerjomataram I, Siegel RL, Torre LA, Jemal A. Global cancer statistics 2018: GLOBOCAN estimates of incidence and mortality worldwide for 36 cancers in 185 countries. CA Cancer
J Clin. 2018;68:394-424. Crossref
2. Edge SB, Compton CC. The American Joint Committee on Cancer: the 7th edition of the AJCC cancer staging manual and the future of TNM. Ann Surg Oncol. 2010;17:1471-4. Crossref
3. Detterbeck FC, Boffa DJ, Kim AW, Tanoue LT. The eighth edition lung cancer stage classification. Chest. 2017;151:193-203. Crossref
4. Ettinger DS, Wood DE, Aisner DL, Akerley W, Bauman J, Chirieac LR, et al. Non–small-cell lung cancer, version 5.2017,
NCCN Clinical Practice Guidelines in Oncology. J Natl Compr
Canc Netw. 2017;15:504-35. Crossref
5. Bacsa S, Czakó Z, Vezendi S. The complications of mediastinoscopy. Panminerva Med. 1974;16:402-6.
6. Bousema JE, Aarts MJ, Dijkgraaf MG, Annema JT, van den Broek FJ. Trends in mediastinal nodal staging and its impact
on unforeseen N2 and survival in lung cancer. Eur Respir J.
2021;57:2001549. Crossref
7. Toloza EM, Harpole L, McCrory DC. Noninvasive staging of non–small-cell lung cancer: a review of the current evidence. Chest. 2003;123 (1 Suppl):137S-46S. Crossref
8. Schirrmeister H, Hetzel M, Buck A. Staging of non–small-cell lung cancer with integrated PET and CT. N Engl J Med. 2003;349:1188-90. Crossref
9. Antoch G, Stattaus J, Nemat AT, Marnitz S, Beyer T, Kuehl H, et al. Non–small-cell lung cancer: dual-modality PET/CT in preoperative staging. Radiology. 2003;229:526-33. Crossref
10. Bryant AS, Cerfolio RJ, Klemm KM, Ojha B. Maximum standard
uptake value of mediastinal lymph nodes on integrated FDG-PET-CT
predicts pathology in patients with non–small-cell lung cancer.
Ann Thorac Surg. 2006;82:417-23. Crossref
11. Hellwig D, Graeter TP, Ukena D, Groeschel A, Sybrecht GW, Schaefers HJ, et al. 18F-FDG PET for mediastinal staging of
lung cancer: which SUV threshold makes sense? J Nucl Med.
2007;48:1761-6. Crossref
12. Hofman MS, Smeeton NC, Rankin SC, Nunan T, O’Doherty MJ. Observer variation in FDG PET-CT for staging of non–small-cell lung carcinoma. Eur J Nucl Med Mol Imaging. 2009;36:194-9. Crossref
13. Mathew B, Purandare NC, Pramesh CS, Karimundackal G, Jiwnani S, Agrawal A, et al. Improving accuracy of
18F-fluorodeoxyglucose PET computed tomography to diagnose
nodal involvement in non–small-cell lung cancer: utility of using
various predictive models. Nucl Med Commun. 2021;42:535-44. Crossref
14. Rogasch JM, Apostolova I, Steffen IG, Steinkrüger FL, Genseke P, Riedel S, et al. Standardized visual reading of F18-FDG-PET in patients with non–small-cell lung cancer scheduled for preoperative thoracic lymph node staging. Eur J Radiol. 2016;85:1345-50. Crossref
15. Boellaard R. Standards for PET image acquisition and quantitative data analysis. J Nucl Med. 2009;50 Suppl 1:11S-20S. Crossref
16. Boellaard R, Krak NC, Hoekstra OS, Lammertsma AA. Effects of noise, image resolution, and ROI definition on the accuracy of standard uptake values: a simulation study. J Nucl Med.
2004;45:1519-27.
17. Boellaard R, Delgado-Bolton R, Oyen WJ, Giammarile F, Tatsch K, Eschner W, et al. FDG PET/CT: EANM procedure
guidelines for tumour imaging: version 2.0. Eur J Nucl Med Mol
Imaging. 2015;42:328-54. Crossref
18. Mountain CF, Dresler CM. Regional lymph node classification for lung cancer staging. Chest. 1997;111:1718-23. Crossref
19. Cloran FJ, Banks KP, Song WS, Kim Y, Bradley YC. Limitations of dual time point PET in the assessment of lung nodules with low FDG avidity. Lung Cancer. 2010;68:66-71. Crossref