
Accuracy and Interobserver Agreement of the Correlation Between Prostate Imaging Reporting and Data System Version 2.1 and International Society of Urological Pathology Scores
ORIGINAL ARTICLE CME
Hong Kong J Radiol 2023 Jun;26(2):100-10 | Epub 7 Jun 2023
Accuracy and Interobserver Agreement of the Correlation Between Prostate Imaging Reporting and Data System Version 2.1 and International Society of Urological Pathology Scores
Gulsen Yucel Oguzdogan1, Zehra Hilal Adibelli1, Ertugrul Sefik2, Hulya Mollamehmetoglu1, Ibrahim Halil Bozkurt2, Enver Vardar3, Bulent Gunlusoy2, Hulya Cetin Tuncez1
1 Department of Radiology, University of Health Sciences, Izmir Faculty of Medicine, Izmir Bozyaka Training
and Research Hospital, Izmir, Turkey
2 Department of Urology, University of Health Sciences, Izmir Faculty of Medicine, Izmir Bozyaka Training and
Research Hospital, Izmir, Turkey
3 Department of Pathology, University of Health Sciences, Izmir Faculty of Medicine, Izmir Bozyaka Training
and Research Hospital, Izmir, Turkey
Correspondence: Dr Gulsen Yucel Oguzdogan, Department of Radiology, University of Health Sciences, Izmir Faculty of Medicine, Izmir Bozyaka Training and Research Hospital, Izmir, Turkey. Email: gulsenyuceloguzdogan@gmail.com
Submitted: 8 Aug 2021; Accepted: 15 Nov 2021.
Contributors: GYO, ZHA and ES designed the study. GYO and HM acquired the data. GYO, HM and HCT analysed the data. GYO drafted the manuscript. GYO and ZHA critically revised the manuscript for important intellectual content. All authors had full access to the data, contributed to the study, approved the final version for publication, and take responsibility for its accuracy and integrity.
Conflicts of Interest: All authors have disclosed no conflicts of interest.
Funding/Support: This research received no specific grant from any funding agency in the public, commercial, or not-for-profit sectors.
Ethics Approval: Ethical approval for the research was obtained from the ethics review committee of University of Health Sciences, Izmir Faculty of Medicine, Izmir Bozyaka Training and Research Hospital, Turkey (Ref No.: 01). Oral and written consent for treatment/procedures and publication were obtained from all patients.
Abstract
Introduction
This research aims to evaluate accuracy and interobserver agreement on the correlation between the
Prostate Imaging Reporting and Data System version 2.1 (PI-RADS v2.1) and the International Society of Urological Pathology (ISUP) scores.
Methods
We examined patients who underwent prostate multiparametric magnetic resonance imaging (MpMRI) prior to transrectal ultrasound–guided cognitive fusion biopsy between April and December 2019. MpMRI examinations were evaluated by two radiologists according to PI-RADS v2.1. Interobserver agreement was recorded and the final PI-RADS category was decided by consensus. The correlation of cognitive fusion biopsy results with PI-RADS v2.1 score was evaluated. Lesions with Gleason score ≥7 were considered to be clinically significant prostate cancer.
Results
A total of 84 patients with 106 lesions were included in the study. The rates of prostate cancer in the PI-RADS groups 1, 2, 3, 4, and 5 were 0%, 0%, 22.2%, 56%, and 94.45%, respectively. There was a positive correlation with an area under the curve value of 0.814 between the PI-RADS v2.1 and the ISUP score. Using PI-RADS ≥3 as the cut-off value in the peripheral zone (PZ) and the whole gland, the negative predictive value for malignancy was 100%. For PI-RADS ≥4, it was 76.47% for PZ and 80.65% for the whole gland. Without applying cut-off values, the interobserver agreement for PI-RADS score was κ = 0.562.
Conclusion
Our data support the notion that PI-RADS v2.1 facilitates the evaluation of MpMRI and improves interobserver agreement.
Key Words: Biopsy; Histology; Magnetic resonance imaging; Neoplasm grading; Prostatic neoplasms
中文摘要
前列腺影像報告和數據系統第2.1版與國際泌尿病理學會評分之間相關性的準確性和觀察者間的一致性
Gulsen Yucel Oguzdogan、Zehra Hilal Adibelli、Ertugrul Sefik、Hulya Mollamehmetoglu、Ibrahim Halil Bozkurt、Enver Vardar、Bulent Gunlusoy、Hulya Cetin Tuncez
簡介
本研究旨在評估前列腺影像報告和數據系統第2.1版(PI-RADS v2.1)與國際泌尿病理學會(ISUP)評分之間相關性的準確性和觀察者間的一致性。
方法
我們檢視2019年4月至12月期間經直腸超聲引導融合活檢之前接受前列腺多參數磁共振成像(MpMRI)的患者。MpMRI檢查由兩名放射科醫生根據PI-RADS v2.1進行評估。研究記錄了觀察者間的一致性,最終的PI-RADS類別由協商決定,並評估融合活檢結果與PI-RADS v2.1評分的相關性。Gleason評分≥7的病變認為是有臨床意義的前列腺癌。
結果
本研究共納入84例患者106個病灶。PI-RADS 1、2、3、4及5組前列腺癌發生率分別為0%、0%、22.2%、56%及94.45%。PI-RADS v2.1與ISUP評分呈正相關,曲線下面積為0.814。以周邊區和整個腺體的PI-RADS≥3為界值,惡性腫瘤的陰性預測值為100%。PI-RADS≥4時,周邊區陰性預測值為76.47%,全腺體陰性預測值則為80.65%。在不應用閾值的情況下,PI-RADS評分的觀察者間一致性為κ= 0.562。
結論
我們的研究數據證明PI-RADS v2.1有助促進MpMRI的評估並增加觀察者間的一致性。
INTRODUCTION
Prostate cancer (PCa) is the most commonly observed
cancer in men in the world and the second most common
cause of cancer-related deaths.[1] A study of 1,056 men
who died from causes other than PCa found that 68% to
77% of men aged 60 to 79 years had occult PCa identified
at autopsy, indicating a high prevalence of the disease.[2] [3]
Advanced-stage PCa poses a high risk of morbidity and
mortality. Recent studies have focused on distinguishing
between lesions expressed as ‘silent disease’ with almost
no malignant potential, such as tumours with a Gleason
score (GS) of 6 and high-grade cancers.[4] Due to limited
sensitivity and specificity of serum prostate-specific
antigen (PSA) screening, digital prostate examination,
and transrectal ultrasound (TRUS)–guided biopsy,
advanced imaging methods are needed to perform
target-specific biopsies and to reduce the negative
biopsy rate.[5] Advanced methodology is needed to direct
patients to treatment or active surveillance. To ensure
standardisation and reduce differences emerging in the
selection of parameters and interpretation of images
in prostate magnetic resonance imaging (MRI), the European Society of Urogenital Radiology issued
relevant guidelines in 2012.[5] [6] Rapid developments in
this field and limitations encountered during the use of
the Prostate Imaging Reporting and Data System version
1 (PI-RADS v1) led to an update of the PI-RADS, and
PI-RADS v2 was subsequently published in 2015.[7]
In 2019, PI-RADS v2.1, including changes ensuring
more accurate and reproducible interpretations, was
published.[8] [9]
This study aimed to investigate the correlation of the
PI-RADS v2.1 score with the histopathological result
and the International Society of Urological Pathology
(ISUP) score in patients with suspected PCa undergoing
multiparametric MRI (MpMRI) examinations scored
with PI-RADS v2.1 and diagnosed with TRUS-guided
cognitive fusion biopsy and to assess the compatibility
between different experience levels of the radiologists.
METHODS
In this single-centre study, 166 consecutive patients
who underwent MpMRI for PCa between April and December 2019 were evaluated. Ethical approval was
obtained from our institution, and oral and written
consents were obtained from all patients. Twelve patients
with unsuitable image quality for evaluation, 26 patients
with a previous biopsy and with PCa treatment before
testing, and 44 patients with no tissue diagnosis due
to PI-RADS 1 or who declined biopsy were excluded
from the study. A total of 106 lesions in 84 patients
diagnosed with TRUS-guided cognitive fusion biopsy
in our hospital were included in the final study group.
Patients’ age, serum PSA value, PSA density (PSAd),
and prostate volume were recorded. The prostate
MpMRI was performed with a 1.5T scanner (Siemens
MAGNETOM Aera; Siemens Inc, Erlangen, Germany)
with an 18-channel pelvic coil according to the protocols
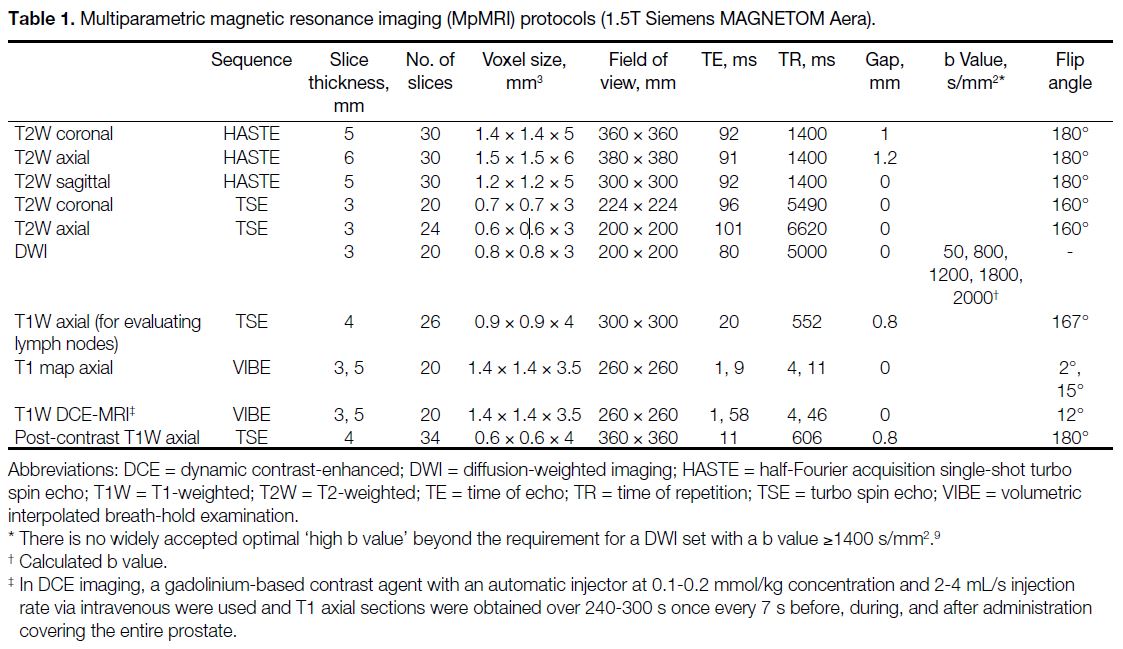
shown in Table 1. All sequences were assessed on a
syngo.via workstation (Siemens, Erlangen, Germany).
Table 1. Multiparametric magnetic resonance imaging (MpMRI) protocols (1.5T Siemens MAGNETOM Aera).
Assessment of Images and Histopathological
Correlation
MpMRI images were evaluated before biopsy according
to the PI-RADS v2.1 guidelines by two radiologists with
25 years of experience (reader 1) and 2 years of experience
(reader 2) in abdominal MRI. The appearance, location,
and dimensions of lesions were first independently
assessed by the two radiologists. Lesion location was
defined according to the sector map in the PI-RADS v2.1 guidelines. Lesions including both the peripheral
zone (PZ) and transitional zone (TZ) or lesions with
extraprostatic extension were defined as diffuse cancer.
Lesions were scored according to PI-RADS v2.1
criteria on T2-weighted imaging (T2WI) and diffusion-weighted
imaging (DWI). Dynamic contrast-enhanced
(DCE) imaging–MRI was defined as ‘negative’ or
‘positive’ and each lesion was given a PI-RADS v2.1
(category 1-5) score for later evaluation of interobserver
agreement. Differences in PI-RADS scores between the
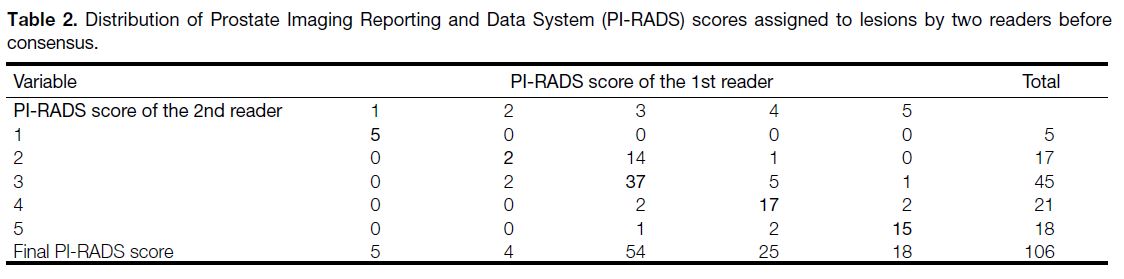
readers were settled by consensus in 28 lesions (Table 2). Interobserver agreement on these variables and
histopathological correlation with PI-RADS v2.1 score
were evaluated. Negative MpMRI findings were scored
as PI-RADS 1.
Table 2. Distribution of Prostate Imaging Reporting and Data System (PI-RADS) scores assigned to lesions by two readers before consensus.
The biopsy decision was based on MpMRI findings
and clinical suspicion of PCa. MpMRI TRUS-guided
cognitive fusion biopsy was performed with an 18-gauge
automatic biopsy needle (Tru-Cut; Merit Medical,
South Jordan [UT], United States). MpMRI TRUS-guided
cognitive fusion biopsy is done by determining
suspicious areas through MpMRI, approximately
defining this area with TRUS and then carrying out the
biopsy procedure. The hypoechogenic-hyperechogenic
foci of ultrasound images during MpMRI TRUS-guided
cognitive fusion biopsy were considered, where two samples were taken from each lesion by correlating
them with the foci defined in MpMRI and marked on
the sector map.[7] In addition to cognitive fusion biopsy,
12-core systematic biopsy was performed for the safety
of the patients. To improve the accuracy of biopsy
localisation, one of three experienced urologists (with
15, 18 and 22 years of experience) performed the TRUS-biopsy
procedure with assistance from both radiologists
to pinpoint the lesion location. Biopsy specimens were
evaluated by a urogenital pathologist. Lesions with GS
≥7 was considered as clinically significant PCa (csPCa).
Lesions were grouped according to the ISUP scoring
method (ISUP 1, GS 3+3; ISUP 2, GS 3+4; ISUP 3, GS
4+3; ISUP 4, GS 4+4; ISUP 5, GS ≥ 9).[10] On MpMRI, lesions with a PI-RADS v2.1 score ≥3 were recorded
as positive, while lesions scoring <3 were recorded as
negative.
Statistical Methods
In descriptive analyses, continuous variables are
presented as mean ± standard deviation or median
(interquartile range) and categorical variables as a
percentage (%). The compliance of the data to normal
distribution was evaluated using the Shapiro–Wilk test.
If the data had a normal distribution, a t test was used to
compare two groups; under non-parametric conditions,
the Mann–Whitney U test was used. Comparison of
continuous variables between three and more categories
was made using the one-way analysis of variance or
the non-parametric equivalent of the Kruskal–Wallis
test. The strength of the correlation between two
continuous variables was assessed using the Spearman’s
rank correlation coefficient. Accordingly, correlation
coefficient (r) values <0.2 show very weak or no
correlation, values from 0.2 to 0.4 show weak correlation,
values from 0.4 to 0.6 show moderate correlation,
values from 0.6 to 0.8 show a high correlation, and
values >0.8 are interpreted as very high correlation.
Interobserver agreement was evaluated using kappa coefficients (κ) and was assessed as follows: 0.01-0.20,
slight agreement; 0.21-0.40, fair agreement; 0.41-0.60,
moderate agreement; 0.61-0.80, substantial agreement;
and 0.81-0.99, almost perfect agreement. To evaluate
the success of the obtained variables, to diagnose PCa,
and to determine cut-off points, the area under the curve
(AUC) of a receiver operating characteristic, sensitivity,
specificity, positive predictive value (PPV), and negative
predictive value (NPV) were computed. SPSS (Windows
version 22.0; IBM Corp, Armonk [NY], United States)
and MedCalc (MedCalc Software Ltd, Mariakerke,
Belgium) were used for statistical analyses. A p value of
< 0.05 was accepted as statistically significant.
RESULTS
The mean age, PSA level, prostate volume, and mean
PSAd values for the 84 cases included in the study
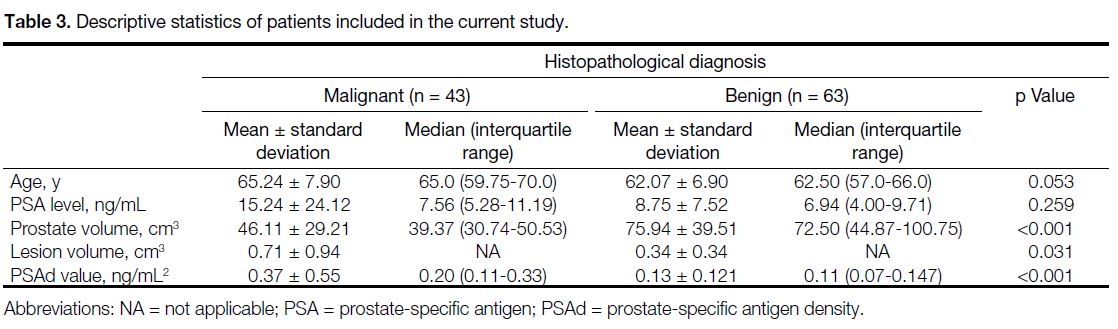
were 63.5 ± 7.5 years, 11.68 ± 17.34 ng/mL, 62.4 ± 38.08 cm3, and 0.23 ± 0.39 ng/mL2, respectively. There
were no statistically significant differences between
malignant and benign diseases for age and PSA values.
Prostate volume in the malignant group was found to be
significantly lower while PSAd was higher than that in
the benign group (both p < 0.001) [Table 3].
Table 3. Descriptive statistics of patients included in the current study.
Of the 106 lesions examined in this study from the 84
patients, 26 (24.5%) were benign prostatic tissue, 36
(34.0%) were prostatitis, 43 (40.6%) were malignant
lesions, and one (0.9%) was high-grade prostatic
intraepithelial neoplasia. Among malignant lesions,
65.1% were localised in the PZ, 14% in the TZ, and
20.9% were diffuse cancers.
These 106 lesions were identified as PI-RADS category
1 (n = 5), 2 (n = 4), 3 (n = 54), 4 (n = 25), and 5 (n = 18).
No malignancy was detected in PI-RADS 1 or 2 lesions.
Systematic biopsy was performed on these patients with
the decision of the clinician due to the increase in PSA
level, rectal examination findings, and the age of the patient. Of the PI-RADS 3, 4, and 5 lesions, the PCa
incidence was 22.2%, 56%, and 94.45%, respectively.
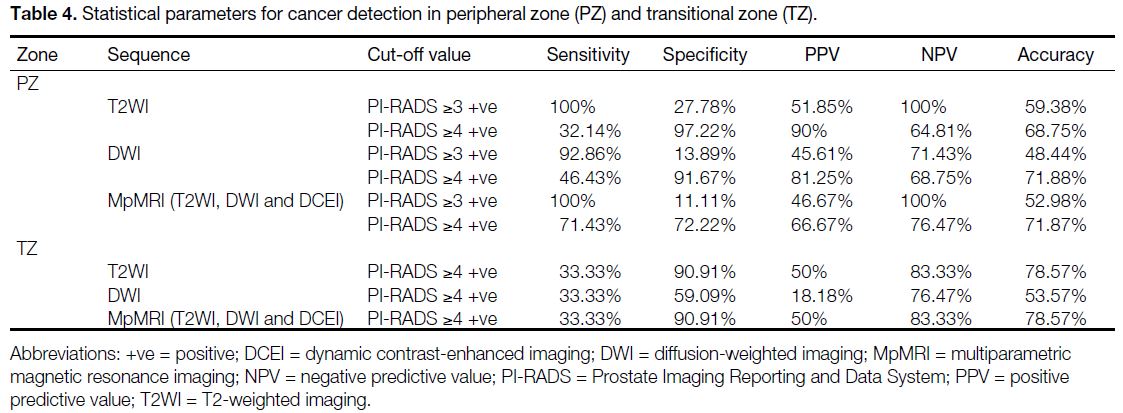
Table 4 shows the statistical parameters in PZ and TZ
when the cut-off value was PI-RADS ≥3 positive and
PI-RADS ≥4 positive for cancer detection on T2WI,
DWI, and T2WI, DWI and DCE imaging combination
(MpMRI). In TZ, there was no patient with PI-RADS
<3, hence the diagnostic parameters for this variable
were not calculated.
Table 4. Statistical parameters for cancer detection in peripheral zone (PZ) and transitional zone (TZ).
Expressed as median (interquartile range), the success of the PI-RADS score to predict cancer was found to have
an AUC value of 0.764 (0.646-0.882) for PZ and 0.629
(0.347-0.910) for TZ. Evaluation by excluding the zonal
anatomy found successful cancer predictions had AUC
values of 0.773 (0.683-0.864), 0.722 (0.621-0.824), 0.740
(0.641-0.838), 0.619 (0.514-0.724), and 0.764 (0.646-0.882) for T2WI, DWI, DCE imaging, combination of T2WI and DWI (biparametric), and combination of T2WI, DWI and DCE imaging (MpMRI), respectively.
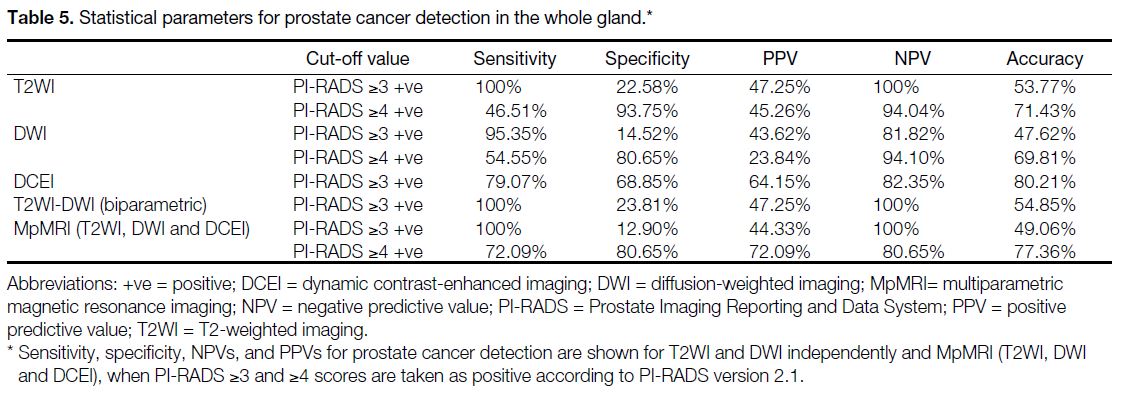
The sensitivity, specificity, NPV, and PPV values for
PCa detection according to PI-RADS v2.1 and regardless
of the zone, for T2WI and DWI independently, for
biparametric and MpMRI assessment when PI-RADS ≥3
and ≥4 positive, are summarised in Table 5. The results
for the cut-off values ≥3 and ≥4 are shown in Tables 4 and 5. The differences observed between sensitivity,
specificity, PPV, and NPV values with each cut-off
value were separately evaluated. Accordingly, when the
PI-RADS score cut-off value ≥4 was taken as positive,
the sensitivity and NPV decreased moderately, while
specificity and PPV increased.
Table 5. Statistical parameters for prostate cancer detection in the whole gland.
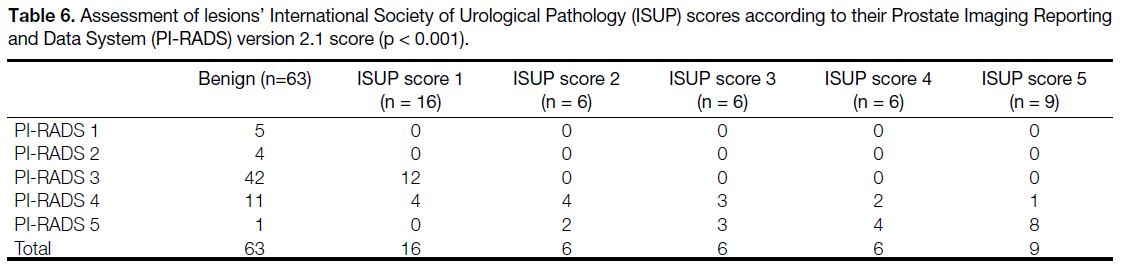
A total of 43 lesions (40.56%) were categorised into
PI-RADS 4 and 5. Among these, 27 lesions (25.47%)
had ISUP score >1. When PI-RADS 3 lesions were
evaluated, 22.2% of these lesions were diagnosed as
PCa, whereas no lesions had ISUP score >1. There was a positive correlation between PI-RADS v2.1 score with
ISUP score and the correlation value was 0.814 (p < 0.001) [Table 6].
Table 6. Assessment of lesions’ International Society of Urological Pathology (ISUP) scores according to their Prostate Imaging Reporting
and Data System (PI-RADS) version 2.1 score (p < 0.001).
In PZ, for ISUP grades 1, 2, 3, 4, and 5, there were four (57.1%), two (28.6%), 0, 0, and one (14.3%) lesions
upgraded to PI-RADS 4 with DWI score 3 and DCE
positivity identified, respectively (Table 7). For lesions
with DWI score 4 and PI-RADS 4, 0, two (33.3%), two
(33.3%), two (33.3%), and 0 lesions were in ISUP grades
1, 2, 3, 4, and 5, respectively. We divided the PI-RADS
4 lesions into two groups according to the DWI score
(DWI 3 and DWI 4). When we compared the lesions in these groups according to ISUP grades (ISUP 1 and >1 in Figures 1 and 2, respectively), we found that the DWI 4 group had higher ISUP grades (p = 0.03).
Table 7. Correlation between International Society of Urological Pathology (ISUP) scores and diffusion-weighted imaging (DWI) scores of Prostate Imaging Reporting and Data System (PI-RADS) 4 lesions in the peripheral zone.
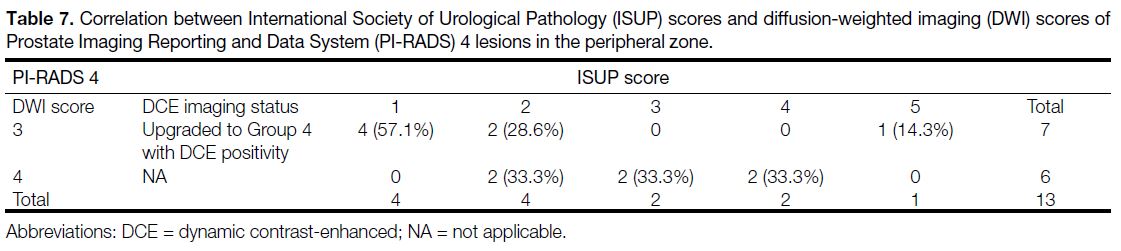
Figure 1. A 56-year-old man with prostate-specific antigen level of 5.6 ng/mL. Arrows indicated a Prostate Imaging Reporting and Data
and System (PI-RADS) version 2.1 category 4 lesion visible in the peripheral zone. (a) Axial T2-weighted magnetic resonance (MR) image
showing the lesion in the left-mid peripheral zone. The dimension of the lesion is 1.0 cm, which is consistent with a PI-RADS score of 3 on
T2-weighted imaging. (b and c) show that the lesion is hypointense on diffusion-weighted imaging (DWI) [b = 50 s/mm2] and hyperintense
on DWI (b = 1800 s/mm2). (d) Apparent diffusion coefficient map indicates that the lesion is mildly hypointense, giving it a PI-RADS score of
3 on DWI. (e) Pre-contrast T1-weighted and (f) dynamic contrast-enhanced MR images show early enhancement within the same location
as the lesion in (a-d) with early enhancement for overall PI-RADS version 2.1 score of 4. Transrectal ultrasound–guided cognitive imaging
fusion biopsy was defined as International Society of Urological Pathology score of 1.
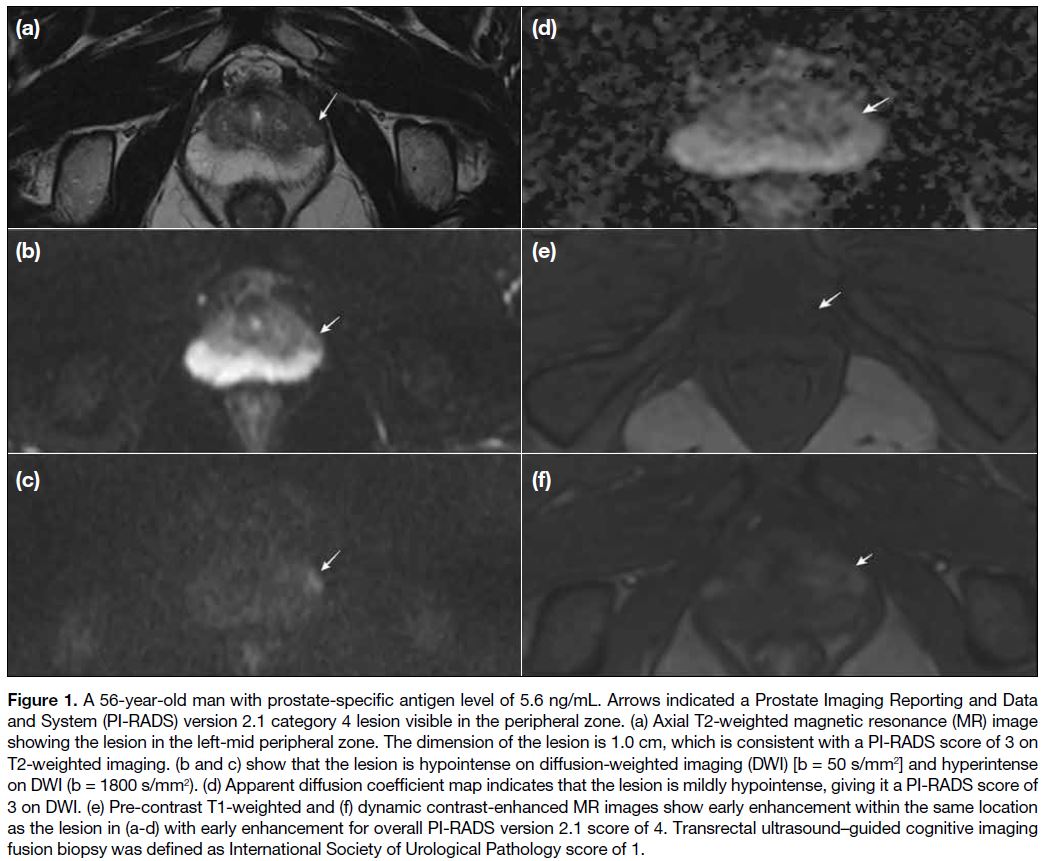
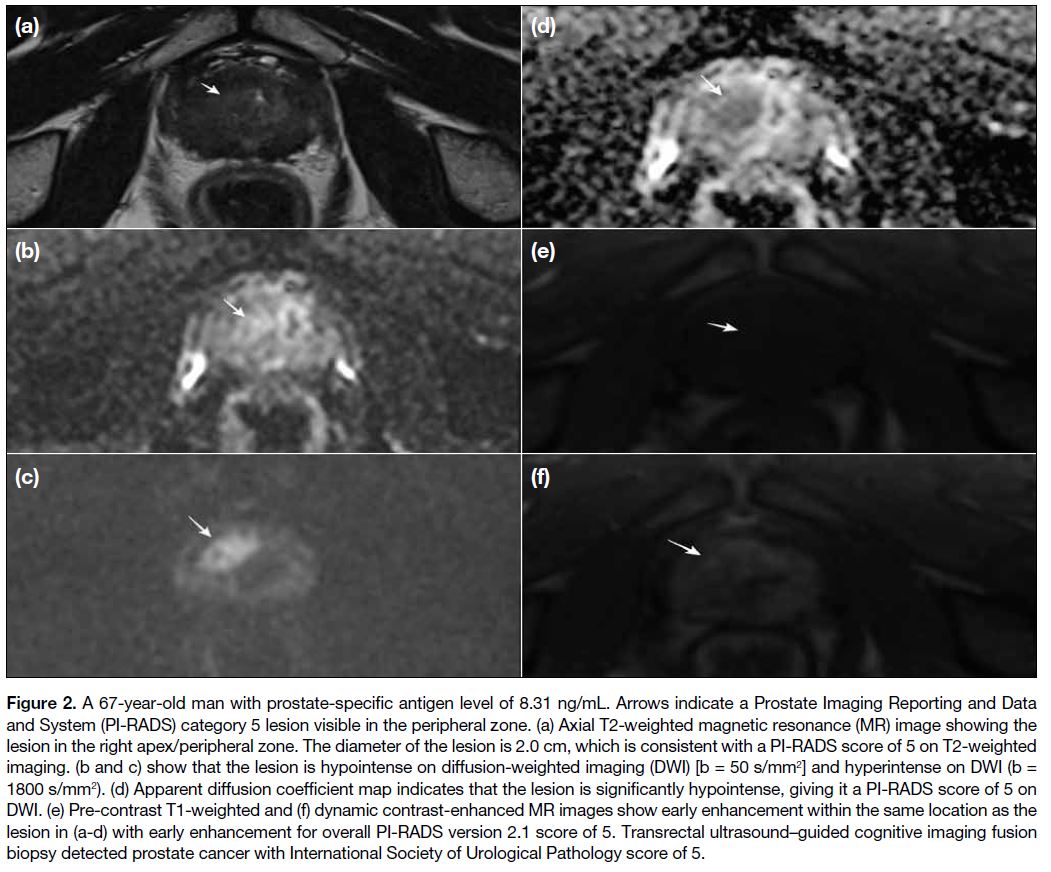
Figure 2. A 67-year-old man with prostate-specific antigen level of 8.31 ng/mL. Arrows indicate a Prostate Imaging Reporting and Data
and System (PI-RADS) category 5 lesion visible in the peripheral zone. (a) Axial T2-weighted magnetic resonance (MR) image showing the
lesion in the right apex/peripheral zone. The diameter of the lesion is 2.0 cm, which is consistent with a PI-RADS score of 5 on T2-weighted
imaging. (b and c) show that the lesion is hypointense on diffusion-weighted imaging (DWI) [b = 50 s/mm2] and hyperintense on DWI (b =
1800 s/mm2). (d) Apparent diffusion coefficient map indicates that the lesion is significantly hypointense, giving it a PI-RADS score of 5 on
DWI. (e) Pre-contrast T1-weighted and (f) dynamic contrast-enhanced MR images show early enhancement within the same location as the
lesion in (a-d) with early enhancement for overall PI-RADS version 2.1 score of 5. Transrectal ultrasound–guided cognitive imaging fusion
biopsy detected prostate cancer with International Society of Urological Pathology score of 5.
The interobserver agreement kappa value (κ) for the
PI-RADS score without applying the cut-off value was
0.562, which represents moderate agreement. When
stratified PI-RADS as <3 and ≥3, the κ for agreement
between the two observers was 0.320, indicating a fair
level of agreement. When stratified PI-RADS as <4 and
≥4, the κ was 0.770, which corresponds to a substantial
agreement. When stratified PI-RADS as <3 and ≥3, the
interobserver agreement for T2WI was moderate with κ = 0.575 and reached the substantial agreement with
κ = 0.814 when PI-RADS was stratified as <4 and ≥4.
Interobserver agreement for DWI was fair with κ = 0.321
when PI-RADS was stratified as <3 and ≥3 but reached
the substantial level when PI-RADS was stratified as <4
and ≥4 (κ = 0.757). For DCE investigation with positive
and negative scores evaluation, interobserver agreement
was at substantial levels with κ = 0.721.
DISCUSSION
Our study revealed that serum PSA level did not
correlate significantly with malignant or benign disease,
and PSAd was significantly elevated in the malignant
group. Jue et al[11] reported a sensitivity of 90% to 95%
for PSAd and, considering the 0.15 ng/mL/cm3 threshold
value, they suggested that a high NPV may prevent unnecessary biopsy in patients with proportional PSA
increase compared to prostate volume. There was a
negative correlation found between prostate volume and
malignancy diagnosis. This result is similar to the results
of studies by Al-Khalil et al[12] and Tang et al,[13] suggesting
that the aetiologies for increasing prostate volume may be
interpreted as due to benign causes such as hyperplasia
and prostatitis. The study of Haas et al[14] presented that
patients with PCa were of advanced age. Droz et al[15]
showed high mean age in the cancer group. In our study,
the mean age in the cancer group was consistent with the
literature and was higher compared to benign diseases
of the prostate gland; however, the difference was not
statistically significant (p = 0.053).
PI-RADS v2 is a scoring system widely used for the detection of PCa and its reliability has been
demonstrated by numerous studies.[16] [17] [18] [19] [20] [21] [22] [23] [24] When we
examined these studies in the literature, the cut-off
value for detection of csPCa on MpMRI of PI-RADS 3
or 4 ranged from 85.7% to 94.5% for sensitivity, 23%
to 71% for specificity, 34% to 97% for PPV, and 50%
to 92% for NPV.[16] [17] [18] [19] [20] [21] Venderink et al[22] determined the
csPCa rates (GS ≥ 3+4) for PI-RADS 3, 4, and 5 lesions
were 17%, 34%, and 67%, respectively. Mathur et al[23]
found the detection rates for csPCa were 6.1%, 33.3%,
and 64.4% for PI-RADS 3, 4, and 5, respectively, and
increased in proportion to the score. A study assessing
737 lesions with MpMRI-targeted TRUS-biopsy found
the PCa rates for PI-RADS 1, 2, 3, 4 and 5 lesions were
0%, 10%, 12%, 22% and 72%, respectively.[24] In our
study, the rates of PCa in PI-RADS 3, 4, and 5 groups were 22.2%, 56%, and 94.45%, respectively. None
of the malignant lesions in the PI-RADS 3 group had
ISUP score >1 pathology results (Table 6). As in all
PI-RADS versions, disease management after scoring is
not specified for patients in PI-RADS v2.1, in which it is
stated that ‘Category 3 lesions are of intermediate status
with an equivocal risk of presenting csPCa’. There are
limited studies in the literature regarding the selection of
cases for follow-up biopsy.[9] [25] Therefore, all PI-RADS
3 lesions were biopsied according to the clinician’s
preference.
There was a positive correlation between the PI-RADS
v2.1 score and the ISUP score (p < 0.001) (Table 7).
A study by Walker et al[26] found a positive correlation
between PI-RADS v2.1 scores and ISUP scores with a correlation value of 0.5 and with increase in malignancies
found with increasing PI-RADS score. Additionally,
consistent with the study findings by Walker et al,[26] we
also found that in the PZ when lesions with DWI score
3 were upgraded to the PI-RADS 4 group with DCE
positivity and PI-RADS 4 lesions with DWI score 4 are
compared, the PI-RADS 4 lesions with DWI score 4
were observed to have higher ISUP scores. These results
clearly show that as the PI-RADS v2.1 score increases,
the csPCa detection rate increases and can be interpreted
as the tumours having more aggressive histopathology.
This indicates that PI-RADS v2.1 is a valid and reliable
scoring system as PI-RADS v2 does. However, in our
study, the histopathological evaluation showed that
25.47% of lesions had ISUP score >1, while 40.56% of
lesions had PI-RADS scores of 4 or 5. Therefore, it is
clear that PI-RADS v2.1 also needs improvements and
more objective recommendations, and further research
may contribute to achieving this aim.
In our study, when cut-off values for PZ and whole gland
are accepted as PI-RADS ≥3, the NPV for malignancy
on MpMRI was 100%. For cut-off value of PI-RADS ≥4
lesions, the values were 76.47% for PZ, 83.33% for TZ,
and 80.65% for the whole gland, which were compatible
with the literature.[27] [28] [29] The high NPV is very important
in terms of excluding cancer for patients without
performing a biopsy. The sensitivity, specificity, PPV,
and NPV analysis in terms of PI-RADS v2.1 sequences
and zones are summarised in Tables 4 and 5. However,
no study in the literature separately evaluated the
sequences in PI-RADS v2.1. When we compared with
meta-analyses performed for PI-RADS v2 in general,
the sensitivity, specificity, PPV, and NPV values for
the sequences were compatible with a meta-analysis by
Chen et al.[30] In a study comparing PI-RADS v2 and v2.1,
the diagnostic sensitivity, specificity, PPV and NPV for
PI-RADS v2.1 were 94.3%, 24.2%, 46.1% and 86.1%
for PZ and 93.8%, 42.1%, 45% and 93% for TZ when
PI-RADS ≥3 was positive for the detection of GS ≥7
tumours by site, respectively.[31] In our study, taking the
PI-RADS score cut-off value as ≥3 positive for PZ, the
sensitivity for PCa was 100%, specificity was 11.11%,
PPV was 46.67%, and NPV was 100%, similar to levels
in the literature for PZ.
Although the PI-RADS v2 is well standardised and
expanded for MpMRI use, studies have reported that
interobserver agreement can be highly variable.[32] [33] [34]
A study with three observers by Popita et al[35] found
the interobserver κ were 0.643, 0.664, and 0.568. A study in which two radiologists examined 170 patients
determined that the interobserver agreement for
PI-RADS ≥3 was substantial (all zones κ = 0.63, PZ
κ = 0.62, TZ κ = 0.53) and for PI-RADS ≥4 was almost
perfect (all zones κ = 0.91, PZ κ = 0.91, TZ κ = 0.87).[36]
Smith et al[37] found the interobserver agreement was fair
with κ = 0.24. Experienced observers demonstrated a
higher level of compatibility in detecting both the whole
gland and PZ lesions than observers with moderate levels
of experience. When the sequence-specific interobserver
agreement is assessed, values were κ = 0.24, 0.24, and
0.23 for T2WI, DWI, and DCE imaging, respectively.[37]
When comparing two radiologists with different levels
of experience, we observed moderate compatibility for
the use of PI-RADS v2.1 without the cut-off value (all
zones κ = 0.562) and the cut-off value of PI-RADS
≥4 (all zones κ = 0.77). Our data show that the use
of PI-RADS v2.1 increases interobserver agreement
with more specific definitions. Increasing observers’
experience and future PI-RADS updates may increase
the agreement between inexperienced observers or
observers with similar experiences.
Limitations
There are two major limitations of this study. Firstly, since the study was prospectively designed, there was no equal
number of lesions according to pathological diagnosis
and zones. Increasing the number of patients in the study
may provide better results and beneficial statistical data
for the literature. Secondly, the TRUS-guided cognitive
fusion biopsy is limited by the operator’s experience and
lack of standardisation, which can impact its success
rate.[38]
CONCLUSION
Our study revealed that PI-RADS v2.1 was highly
effective in detecting lesions, determining patient
selection for biopsy, and identifying risk level for patients
with suspected PCa. Our data support the notion that
PI-RADS v2.1 has improved interobserver agreement
within the framework of PI-RADS, despite the presence
of weak points that need to be addressed. When the cut-off
value for cancer detection is increased to PI-RADS
≥4 from PI-RADS ≥3, the significant increase in the
specificity, PPV, and interobserver agreement suggests
that the PI-RADS 3 criteria should be revised in new
versions of the PI-RADS. When lesions with DCE
positivity and DWI score 3 upgraded from PI-RADS
3 to 4 and PI-RADS 4 lesions with DWI score 4 are
compared, we identified significant differences between
ISUP scores. For this reason, we suggest there should be differences in the scoring of these groups. We believe
that, as more data are to be obtained with further studies,
PI-RADS guidelines will be more accurate.
REFERENCES
1. Siegel RL, Miller KD, Fuchs HE, Jemal A. Cancer statistics, 2021. CA Cancer J Clin. 2021;71:7-33. Crossref
2. Johnson LM, Turkbey B, Figg WD, Choyke PL. Multiparametric MRI in prostate cancer management. Nat Rev Clin Oncol.
2014;11:346-53. Crossref
3. Drost FJ, Rannikko A, Valdagni R, Pickles T, Kakehi Y, Remmers S, et al. Can active surveillance really reduce the harms of overdiagnosing prostate cancer? A reflection of real life clinical practice in the PRIAS study. Transl Androl Urol. 2018;7:98-105. Crossref
4. Dinh AH, Melodelima C, Souchon R, Lehaire J, Bratan F, Mège-Lechevallier F, et al. Quantitative analysis of prostate
multiparametric MR images for detection of aggressive prostate
cancer in the peripheral zone: a multiple imager study. Radiology.
2016;280:117-27. Crossref
5. Barentsz JO, Richenberg J, Clements R, Choyke P, Verma S, Villeirs G, et al. ESUR prostate MR guidelines 2012. Eur Radiol. 2012 ;22 :746-57. Crossref
6. Mottet N, Bellmunt J, Bolla M, Briers E, Cumberbatch MG, De Santis M, et al. EAU-ESTRO-SIOG Guidelines on Prostate
Cancer. Part 1: Screening, diagnosis, and local treatment with
curative intent. Eur Urol. 2017;71:618-29. Crossref
7. American College of Radiology. PI-RADSTM Prostate Imaging–Reporting and Data System. 2015. Available from: https://www.acr.org/Clinical-Resources/Reporting-and-Data-Systems/PI-RADS. Accessed 8 May 2023.
8. Richenberg JL. PI-RADS: past, present and future. Clin Radiol. 2016;71:23-4. Crossref
9. American College of Radiology. PI-RADS. Prostate imaging–reporting and data system. 2019 version 2.1. Available from: https://www.acr.org/-/media/ACR/Files/RADS/Pi-RADS/PIRADS-v2-1.pdf. Accessed 8 May 2023.
10. Epstein JI, Zelefsky MJ, Sjoberg DD, Nelson JB, Egevad L, Magi-Galluzzi C, et al. A contemporary prostate cancer grading system: a validated alternative to the Gleason score. Eur Urol. 2016;69:428-35. Crossref
11. Jue JS, Barboza MP, Prakash NS, Venkatramani V, Sinha VR,
Pavan N, et al. Re-examining prostate-specific antigen (PSA)
density: defining the optimal PSA range and patients for using PSA
density to predict prostate cancer using extended template biopsy.
Urology. 2017;105:123-8. Crossref
12. Al-Khalil S, Ibilibor C, Cammack JT, de Riese W. Association
of prostate volume with incidence and aggressiveness of prostate
cancer. Res Rep Urol. 2016;8:201-5. Crossref
13. Tang P, Jin XL, Uhlman M, Lin YR, Deng XR, Wang B, et al. Prostate volume as an independent predictor of prostate cancer in men with PSA of 10-50 ng ml(-1). Asian J Androl. 2013;15:409-12. Crossref
14. Haas GP, Delongchamps N, Brawley OW, Wang CY, de la Roza G. The worldwide epidemiology of prostate cancer: perspectives from autopsy studies. Can J Urol. 2008;15:3866-71.
15. Droz JP, Balducci L, Bolla M, Emberton M, Fitzpatrick JM, Joniau S, et al. Management of prostate cancer in older men: Recommendations of a working group of the International Society
of Geriatric Oncology. BJU Int. 2010;106:462-9. Crossref
16. Ahmed HU, El-Shater Bosaily A, Brown LC, Gabe R, Kaplan R,
Parmar MK, et al. Diagnostic accuracy of multi-parametric MRI
and TRUS biopsy in prostate cancer (PROMIS): a paired validating
confirmatory study. Lancet. 2017;389:815-22. Crossref
17. Grey AD, Chana MS, Popert R, Wolfe K, Liyanage SH, Acher PL. Diagnostic accuracy of magnetic resonance imaging (MRI) prostate imaging reporting and data system (PI-RADS) scoring
in a transperineal prostate biopsy setting. BJU Int. 2015;115:728-35. Crossref
18. Abd-Alazeez M, Kirkham A, Ahmed HU, Arya M, Anastasiadis E,
Charman SC, et al. Performance of multiparametric MRI in men
at risk of prostate cancer before the first biopsy: a paired validating
cohort study using template prostate mapping biopsies as the
reference standard. Prostate Cancer Prostatic Dis. 2014;17:40-6. Crossref
19. Thompson JE, Moses D, Shnier R, Brenner P, Delprado W,
Ponsky L, et al. Multiparametric magnetic resonance imaging
guided diagnostic biopsy detects significant prostate cancer and
could reduce unnecessary biopsies and over detection: a prospective
study. J Urol. 2014;192:67-74. Crossref
20. Zhang L, Tang M, Chen S, Lei X, Zhang X, Huan Y. A meta-analysis of use of Prostate Imaging Reporting and Data System Version 2 (PI-RADS V2) with multiparametric MR imaging for
the detection of prostate cancer. Eur Radiol. 2017;27:5204-14. Crossref
21. Woo S, Suh CH, Kim SY, Cho JY, Kim SH. Diagnostic performance of prostate imaging reporting and data system
version 2 for detection of prostate cancer: a systematic review and
diagnostic meta-analysis. Eur Urol. 2017;72:177-88. Crossref
22. Venderink W, van Luijtelaar A, Bomers JG, van der Leest M,
Hulsbergen-van de Kaa C, Barentsz JO, et al. Results of targeted
biopsy in men with magnetic resonance imaging lesions classified
equivocal, likely or highly likely to be clinically significant prostate
cancer. Eur Urol. 2018;73:353-60. Crossref
23. Mathur S, O’Malley ME, Ghai S, Jhaveri K, Sreeharsha B,
Margolis M, et al. Correlation of 3T multiparametric prostate
MRI using prostate imaging reporting and data system (PIRADS)
version 2 with biopsy as reference standard. Abdom Radiol (NY).
2019;44:252-8. Crossref
24. Mehralivand S, Bednarova S, Shih JH, Mertan FV, Gaur S,
Merino MJ, et al. Prospective evaluation of PI-RADSTM version
2 using the International Society of Urological Pathology prostate
cancer grade group system. J Urol. 2017;198:583-90. Crossref
25. Yang S, Zhao W, Tan S, Zhang Y, Wei C, Chen T, et al. Combining
clinical and MRI data to manage PI-RADS 3 lesions and reduce
excessive biopsy. Transl Androl Urol. 2020;9:1252-61. Crossref
26. Walker SM, Mehralivand S, Harmon SA, Sanford T, Merino MJ, Wood BJ, et al. Prospective evaluation of PI-RADS version 2.1 for prostate cancer detection. AJR Am J Roentgenol. 2020;215:1098-103. Crossref
27. Wysock JS, Mendhiratta N, Zattoni F, Meng X, Bjurlin M,
Huang WC, et al. Predictive value of negative 3T multiparametric
magnetic resonance imaging of the prostate on 12-core biopsy
results. BJU Int. 2016;118:515-20. Crossref
28. Pokorny MR, de Rooij M, Duncan E, Schröder FH, Parkinson R, Barentsz JO, et al. Prospective study of diagnostic accuracy comparing prostate cancer detection by transrectal ultrasound-guided biopsy versus magnetic resonance (MR) imaging with
subsequent MR-guided biopsy in men without previous prostate
biopsies. Eur Urol. 2014;66:22-9. Crossref
29. Itatani R, Namimoto T, Atsuji S, Katahira K, Morishita S, Kitani K,
et al. Negative predictive value of multiparametric MRI for prostate
cancer detection: outcome of 5-year follow-up in men with negative
findings on initial MRI studies. Eur J Radiol. 2014;83:1740-5. Crossref
30. Chen Z, Zheng Y, Ji G, Liu X, Li P, Cai L, et al. Accuracy ofdynamic contrast-enhanced magnetic resonance imaging in the diagnosis of prostate cancer: systematic review and meta-analysis.
Oncotarget. 2017;8:77975-89. Crossref
31. Rudolph MM, Baur AD, Cash H, Haas M, Mahjoub S, Hartenstein A, et al. Diagnostic performance of PI-RADS version
2.1 compared to version 2.0 for detection of peripheral and
transition zone prostate cancer. Sci Rep. 2020;10:15982. Crossref
32. Benndorf M, Hahn F, Krönig M, Jilg CA, Krauss T, Langer M, et al.
Diagnostic performance and reproducibility of T2w based and
diffusion weighted imaging (DWI) based PI-RADSv2 lexicon
descriptors for prostate MRI. Eur J Radiol. 2017;93:9-15. Crossref
33. Greer MD, Shih JH, Barrett T, Bednarova S, Kabakus I, Law YM,
et al. All over the map: an interobserver agreement study of tumor
location based on the PI-RADSv2 sector map. J Magn Reson
Imaging. 2018;48:482-90. Crossref
34. Sonn GA, Fan RE, Ghanouni P, Wang NN, Brooks JD, Loening
AM, et al. Prostate magnetic resonance imaging interpretation varies
substantially across radiologists. Eur Urol Focus. 2019;5:592-9. Crossref
35. Popita C, Popita AR, Andrei A, Rusu A, Fetica B, Petrut B, et al. Interobserver agreement in prostate cancer detection using multiparametric MRI. J BUON. 2018;23:1061-9.
36. Purysko AS, Bittencourt LK, Bullen JA, Mostardeiro TR, Herts BR, Klein EA. Accuracy and interobserver agreement for Prostate Imaging Reporting and Data System, version 2, for the
characterization of lesions identified on multiparametric MRI of
the prostate. AJR Am J Roentgenol. 2017;209:339-49. Crossref
37. Smith CP, Harmon SA, Barrett T, Bittencourt LK, Law YM,
Shebel H, et al. Intra- and interreader reproducibility of PI-RADSv2:
a multireader study. J Magn Reson Imaging. 2019;49:1694-703. Crossref
38. Brown AM, Elbuluk O, Mertan F, Sankineni S, Margolis DJ, Wood BJ, et al. Recent advances in image-guided targeted prostate biopsy. Abdom Imaging. 2015;40:1788-99. Crossref