Clinical Applications of Amino Acid Positron Emission Tomography–Magnetic Resonance Imaging in Neuro-Oncology: A Pictorial Essay
PICTORIAL ESSAY
Hong Kong J Radiol 2025 Jun;28(2):e128-40 | Epub 13 June 2025
Clinical Applications of Amino Acid Positron Emission Tomography–Magnetic Resonance Imaging in Neuro-Oncology:
A Pictorial Essay
JCY Lam1, SSM Lo2, DYW Siu2, PW Cheng2
1 Department of Radiology, Tuen Mun Hospital Neuroscience Centre, Hong Kong SAR, China
2 Scanning Department, St Teresa’s Hospital, Hong Kong SAR, China
Correspondence: Dr JCY Lam, Department of Radiology, Tuen Mun Hospital Neuroscience Centre, Hong Kong SAR, China. Email: ljc057@ha.org.hk
Submitted: 24 July 2024; Accepted: 24 July 2024.
Contributors: All authors designed the study, acquired the data, analysed the data, drafted the manuscript, and critically revised the manuscript for important intellectual content. All authors had full access to the data, contributed to the study, approved the final version for publication, and take responsibility for its accuracy and integrity.
Conflicts of Interest: All authors have disclosed no conflicts of interest.
Funding/Support: This study received no specific grant from any funding agency in the public, commercial, or not-for-profit sectors.
Data Availability: All data generated or analysed during the present study are available from the corresponding author on reasonable request.
Ethics Approval: This study was approved by St Teresa’s Hospital Research Ethics Committee, Hong Kong (Ref No.: MGT-POL-008). The
patients were treated in accordance with the Declaration of Helsinki. Informed consent was obtained from patients aged 18 years or older and
the carers of patients aged under 18 years for all treatments and procedures, as well as for the publication of this article and the accompanying images.
Acknowledgement: The authors thank the research staff at the Scanning Department of St Teresa’s Hospital for their assistance in data collection.
INTRODUCTION
Management of an intracranial neoplasm involves
sophisticated neuroimaging investigations. Magnetic
resonance imaging (MRI) is important in diagnosing
primary brain tumour, though it has limitations.
Gadolinium-enhanced MRI can assess the morphology
but does not allow determination of tumour metabolism.
It also has limitations in evaluating non-enhancing
gliomas. Magnetic resonance spectroscopy (MRS)
provides information on the presence of neuronal and
membrane metabolites. However, it has poor spatial
resolution and is prone to susceptibility artefact.
18F-fluorodeoxyglucose positron emission tomography
(PET)/computed tomography can give clues on tumour
metabolism, yet interpretation can be unreliable due to
high background brain uptake of 18F-fluorodeoxyglucose.
In past decades, metabolic imaging with amino acid tracers (e.g., 11C-methionine [11C-MET] and
18F-fluoroethyl-L-tyrosine [18F-FET]) has established its added value in the non-invasive investigation of brain
tumours. The pairing of amino acid PET (AA-PET) with
MRI allows evaluation of both tumour morphology and
corresponding metabolic activity in a single visit to the
imaging institution. This pictorial review will illustrate
the clinical applications of AA-PET/MRI in neuro-oncology.
MECHANISM OF RADIOLABELLED AMINO ACID POSITRON EMISSION TOMOGRAPHY TRACER
Amino acids play an essential role in many cellular
processes. In addition to passive diffusion, the majority
of amino acid uptake is governed by carriers such as large
amino acid transporters (LATs) and the alanine-serine-cysteine transporter (ASCT). An LAT subtype, LAT1,
is present at both the luminal and abluminal sides of the
endothelial cell; it plays a crucial role in transporting
amino acids across the blood-brain barrier. Unlike
gadolinium contrast used in MRI, an intact blood-brain
barrier does not limit the uptake of amino acids into an
actively proliferating neoplasm.
Compared with healthy brain tissue, brain tumour cells
significantly overexpress LAT1 and ASCT2, a subtype
of ASCT, resulting in increased amino acid uptake by
tumour and increased amino acid metabolism. Normal
brain tissue has low expression of these transporters,
resulting in the markedly lower amino acid tracer
background activity and high tumour-to-normal tissue
contrast in AA-PET.
An increased rate of metabolism in biological processes
involving deoxyribonucleic acid and protein synthesis
for cell growth and proliferation results in increased
uptake of methionine, which involves LAT1, ASCT and
ASCT2 transporters. The major limitation of 11C-MET
PET study is the short half-life of the 11C-radiotracer (20
minutes). An on-site cyclotron facility is required for its
production prior to the study.
18F-FET, another amino acid tracer, shows similar uptake
and image contrast by brain tumours compared with
11C-MET. 18F-FET is metabolically inert which facilitates
kinetic analysis for distinguishing high-grade from low-grade
gliomas. It is easier to produce and has a longer
half-life (110 minutes), making it more convenient for
clinical applications.
DIFFERENTIATING NEOPLASMS AND NON-NEOPLASTIC LESIONS
11C-MET PET imaging and 18F-FET PET imaging can be used to distinguish gliomas from non-neoplastic
lesions. Early diagnosis can guide timely treatment and
avoid unnecessarily invasive workups, particularly for
paediatric patients and for lesions in eloquent areas.
Based on the 2019 European guidelines,[1] qualitative
and semi-quantitative evaluations can be performed
with cutoff thresholds depending on clinical questions.
To differentiate neoplastic from non-neoplastic tissue,
the recommended cutoff thresholds for definition of
biological tumour volume are: (1) a standardised uptake
value (SUV) of 11C-MET PET imaging >1.3 × the mean
value of healthy brain[2]; or (2) a SUV of 18F-FET PET
imaging >1.6 to 1.8 × the mean value of healthy brain.[3]
For 18F-FET PET imaging, the recommended threshold
to differentiate between neoplastic and non-neoplastic
tissue is a maximum tumour-to-background ratio (TBR)
[TBRmax] of 2.5 or a mean TBR (TBRmean) of 1.9.[1] High tracer uptake with TBRmax exceeding 2.5 was found
to have a high positive predictive value for detecting
neoplastic lesions.[4] A commonly used threshold for
11C-MET uptake is a TBRmax of 1.3 to 1.5.[2] [5]
A 15-year-old patient presented with panhypopituitarism.
MRI of the pituitary gland before and after gadolinium
contrast showed pituitary stalk thickening with a
hypoenhancing lesion involving the pituitary gland and
stalk (Figure 1). 11C-MET PET/MRI showed strong tracer
activity within the gland and along the stalk, suggesting
an active neoplastic process (Figure 2). The diagnosis was biopsy-proven pituitary gland germinoma. The
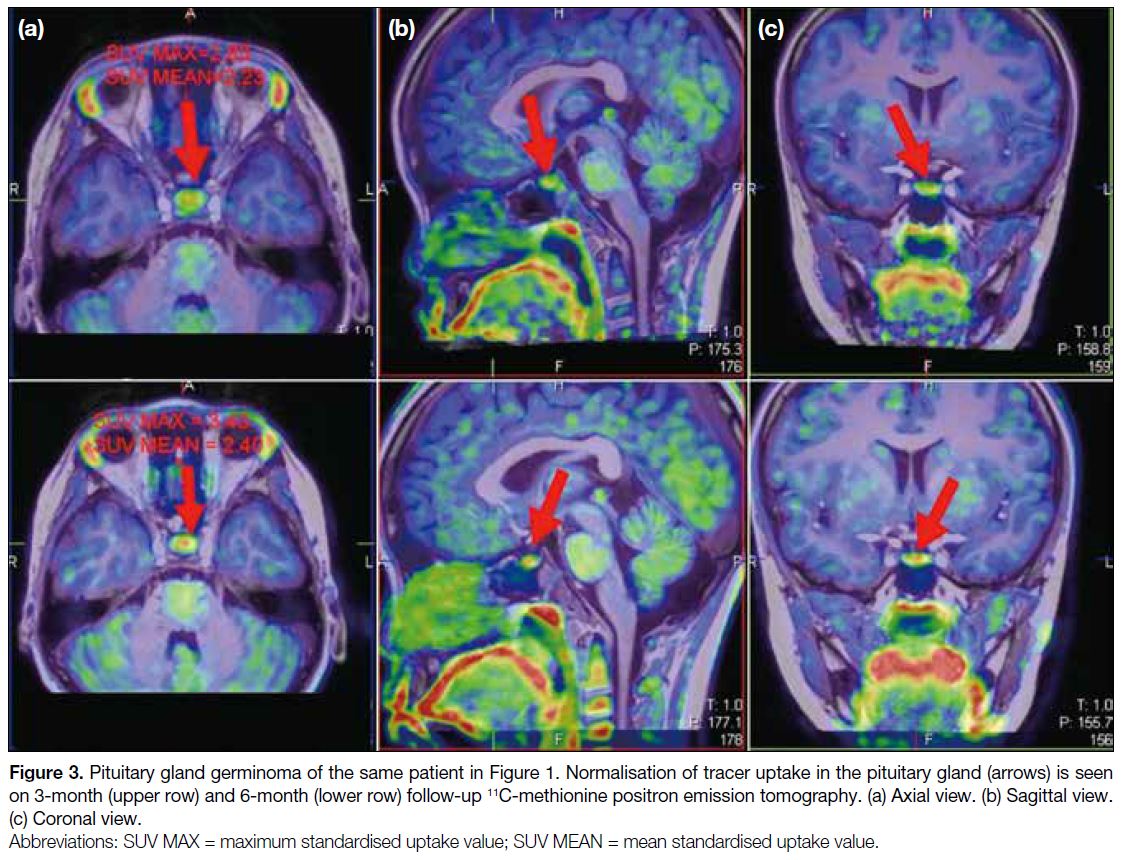
patient underwent chemoradiation. Follow-up 11C-MET
PET/MRI at 3 and 6 months showed normalisation of
tracer uptake in the pituitary gland (Figure 3), suggesting
complete response to treatment.
Figure 1. Pituitary gland
germinoma of a 15-year-old
patient. (a) Pituitary stalk
thickening with prominent size
of the pituitary gland is seen on
T2-weighted sagittal magnetic
resonance imaging (MRI) [arrow].
(b) Hypoenhancing lesion involves
the pituitary gland and stalk on
post-gadolinium T1-weighted
MRI [arrow].
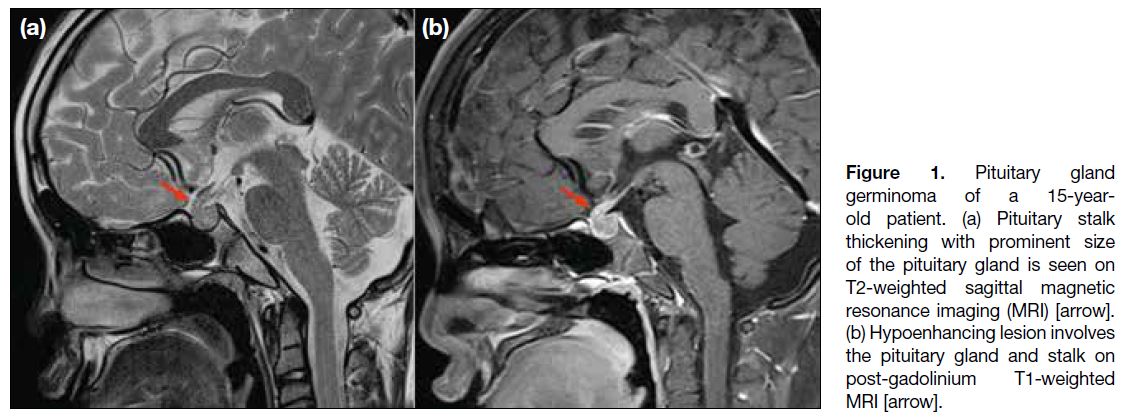
Figure 2. Pituitary gland germinoma of the same patient in Figure 1. Pituitary stalk thickening with prominent pituitary gland is seen on pre-treatment
T2-weighted magnetic resonance images (upper row) [arrows]. Strong 11C-methionine tracer uptake is noted within the pituitary
gland and along the pituitary stalk on pre-treatment hybrid positron emission tomography–magnetic resonance images (lower row) [arrows].
(a) Axial view. (b) Sagittal view. (c) Coronal view.
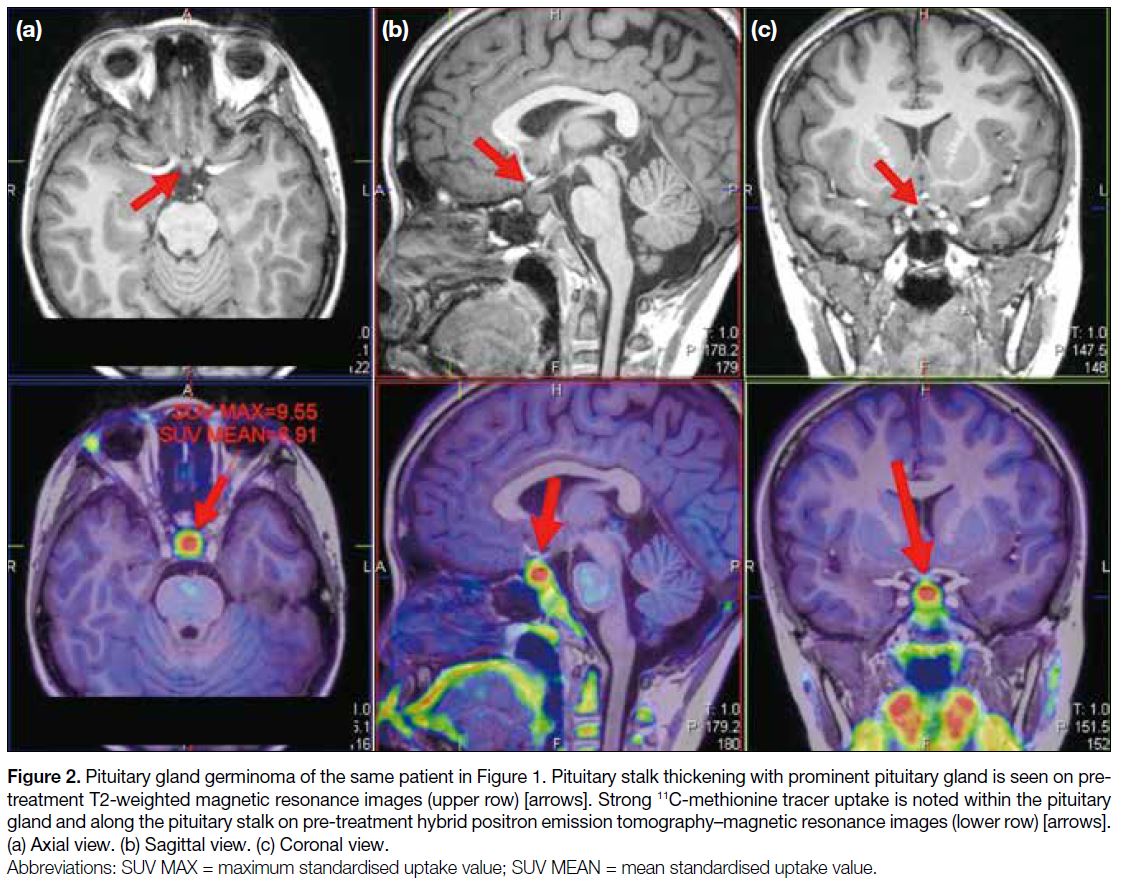
Figure 3. Pituitary gland germinoma of the same patient in Figure 1. Normalisation of tracer uptake in the pituitary gland (arrows) is seen
on 3-month (upper row) and 6-month (lower row) follow-up 11C-methionine positron emission tomography. (a) Axial view. (b) Sagittal view.
(c) Coronal view.
A 12-year-old patient presented with left-sided
weakness. Computed tomography of the brain showed
a hyperdense lesion in the right basal ganglia. MRI
showed an ill-defined T2-weighted hyperintense lesion
in the right posterior basal ganglia and the thalamus with
enhancement and restricted diffusion. No choline peak
was detected on MRS (Figure 4). 11C-MET PET/MRI
showed significantly increased 11C-MET tracer activity
(TBRmean = 1.80; TBRmax = 2.24) [Figure 5], suggesting
an active neoplastic process. The patient was treated
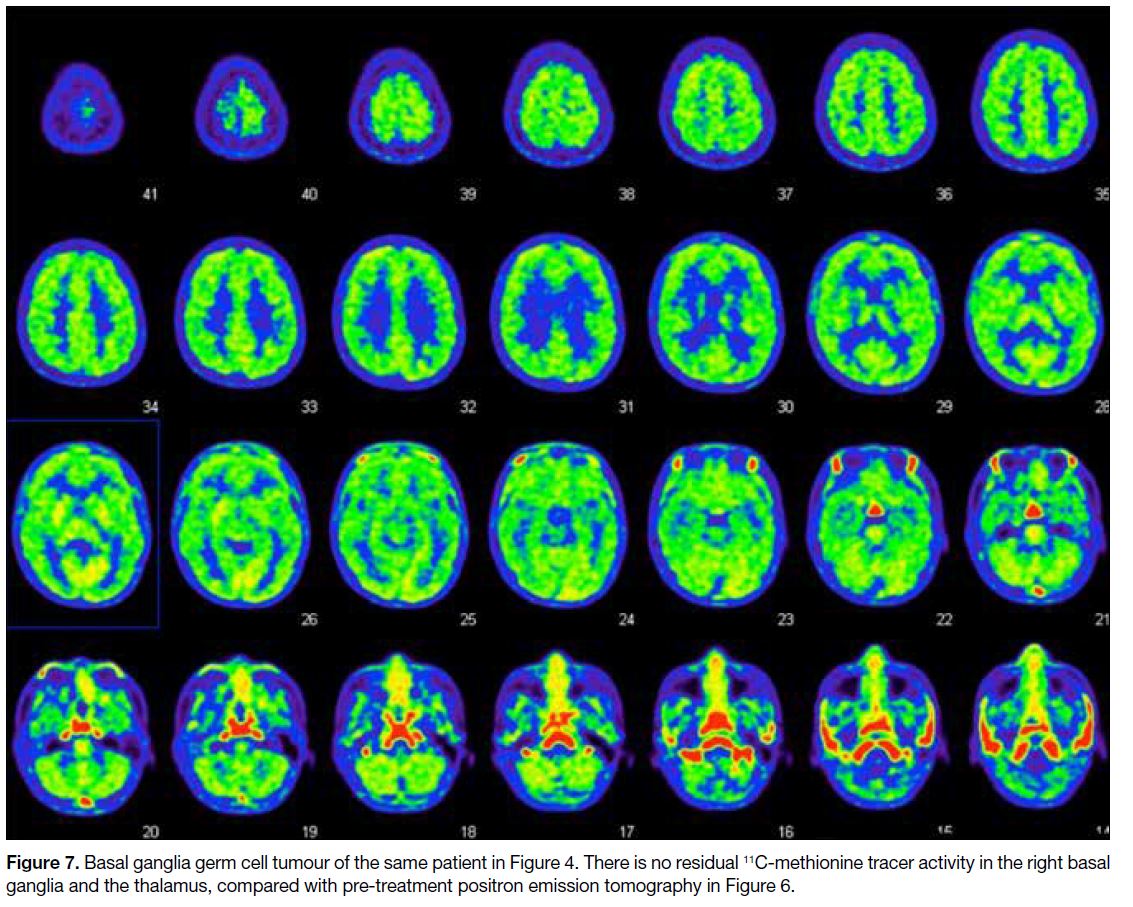
with chemoradiation. Follow-up PET/MRI showed
decreasing T2-weighted signal and no residual 11C-MET tracer activity in the right basal ganglia and the thalamus
(Figures 6 and 7), suggesting complete response to
treatment. For lesions in eloquent areas, AA-PET can
depict the location of highest metabolic activity to
indicate the most appropriate site for biopsy and increase
the chance of obtaining the best representative tumour
tissue. AA-PET also has advantages in detecting foci of
high-grade glioma within a background of lower-grade
tumour,[6] particularly when conventional MRI fails to
identify heterogeneity.
Figure 4. Basal ganglia germ cell tumour of a 12-year-old patient. (a) Hyperdense lesion on computed tomography (arrow). (b) Infiltrative
T2-weighted hyperintense lesion in the right posterior basal ganglia and the thalamus (arrow) with mild enhancement on post-gadolinium
T1-weighted magnetic resonance imaging (c) [arrow]. The corresponding lesion showed restricted diffusion on diffusion-weighted imaging
(d) and apparent diffusion coefficient mapping (e) [arrows]. There is no significant elevation of choline peak on magnetic resonance
spectroscopy (f).
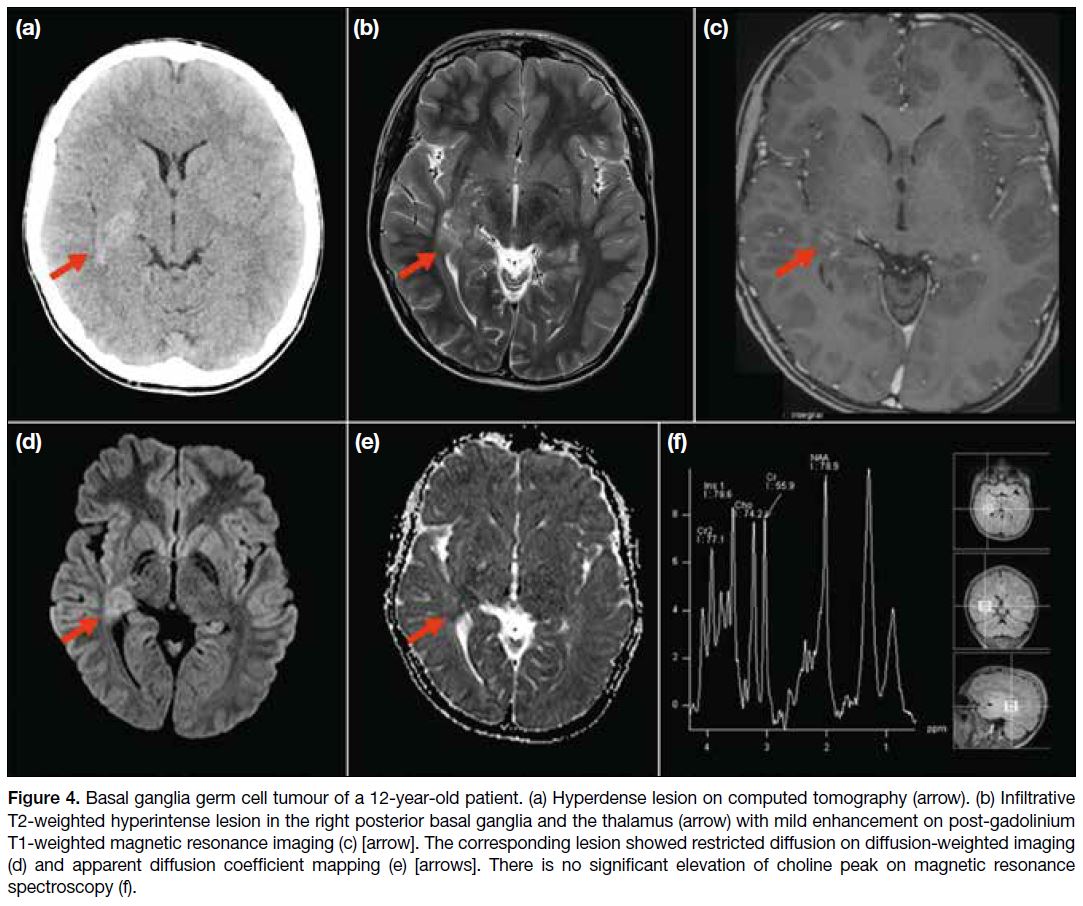
Figure 5. Basal ganglia germ cell tumour of the same patient in Figure 4, which is hyperintense in the right basal ganglia and the thalamus
on T2-weighted magnetic resonance imaging (upper row) [arrows]. There is increased 11C-methionine tracer activity in the right basal ganglia
and the thalamus (lower row) [arrows]. (a) Axial view. (b) Sagittal view. (c) Coronal view.
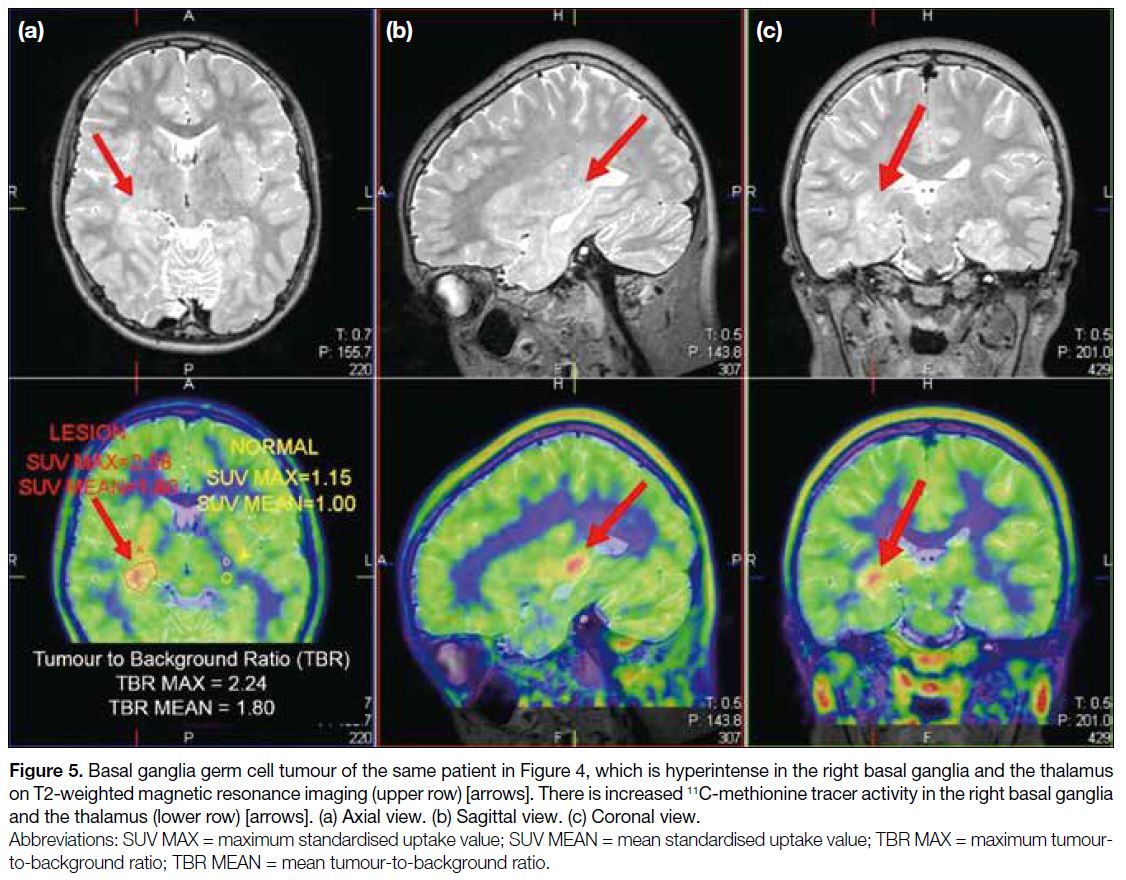
Figure 6. Basal ganglia germ cell tumour of the same patient in Figure 4. There is increased 11C-methionine tracer activity in the right basal ganglia (arrows) in pre-treatment positron emission tomography.
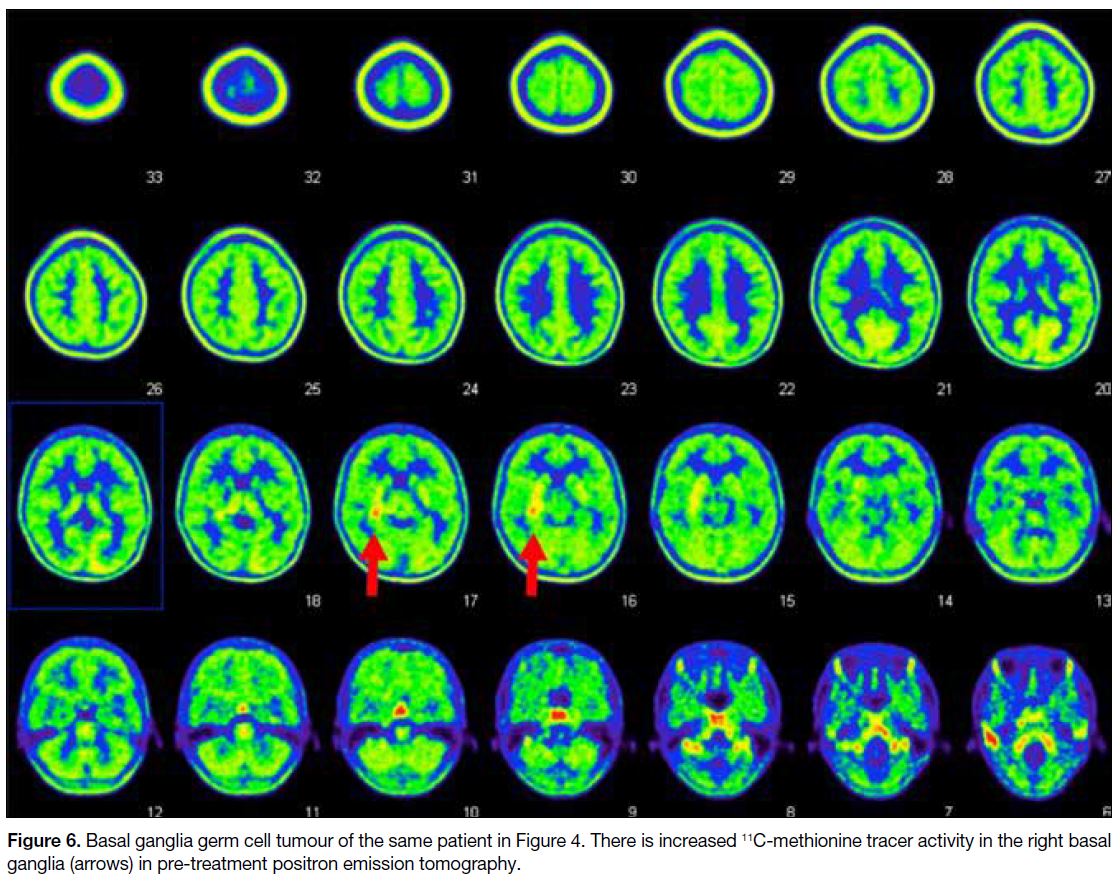
Figure 7. Basal ganglia germ cell tumour of the same patient in Figure 4. There is no residual 11C-methionine tracer activity in the right basal
ganglia and the thalamus, compared with pre-treatment positron emission tomography in Figure 6.
With good tumour-to-background signal contrast, AA-PET/
MRI can also be performed for spinal tumours.
A 50-year-old patient presented with limb weakness
and numbness. MRI of the cervical spine showed
syringohydromyelia with an enhancing soft tissue nodule
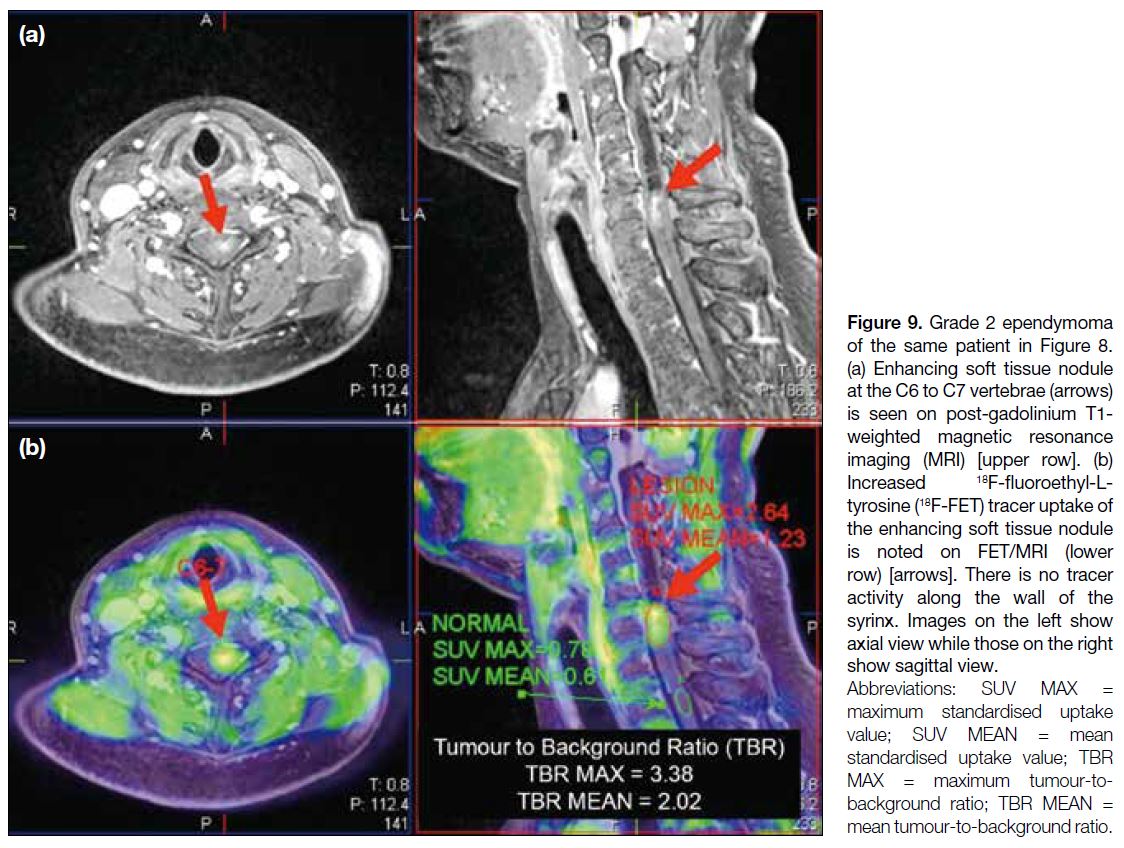
at the C6 to C7 vertebrae (Figure 8). 18F-FET PET/MRI
showed increased tracer uptake at the corresponding site of enhancing soft tissue nodule with significantly
increased TBRmean of 2.02 and TBRmax of 3.38 (Figure 9), suggesting active neoplastic growth. The wall of the
syrinx showed no increased tracer activity to suggest
tumoural involvement. An AA-PET/MRI study in this
case depicted the exact tumour site for operation. A study
showed incorporation of AA-PET imaging increased the
number of complete resections, which was associated
with prolonged survival.[7]
Figure 8. Grade 2 ependymoma
of a 50-year-old patient. (a) Syringohydromyelia with an inferiorly located soft tissue nodule at the C6 to C7 vertebrae is seen on T2-weighted magnetic resonance imaging (MRI) [arrow]. (b) Enhancement of the soft tissue nodule is noted on post-gadolinium T1-weighted MRI (arrow).
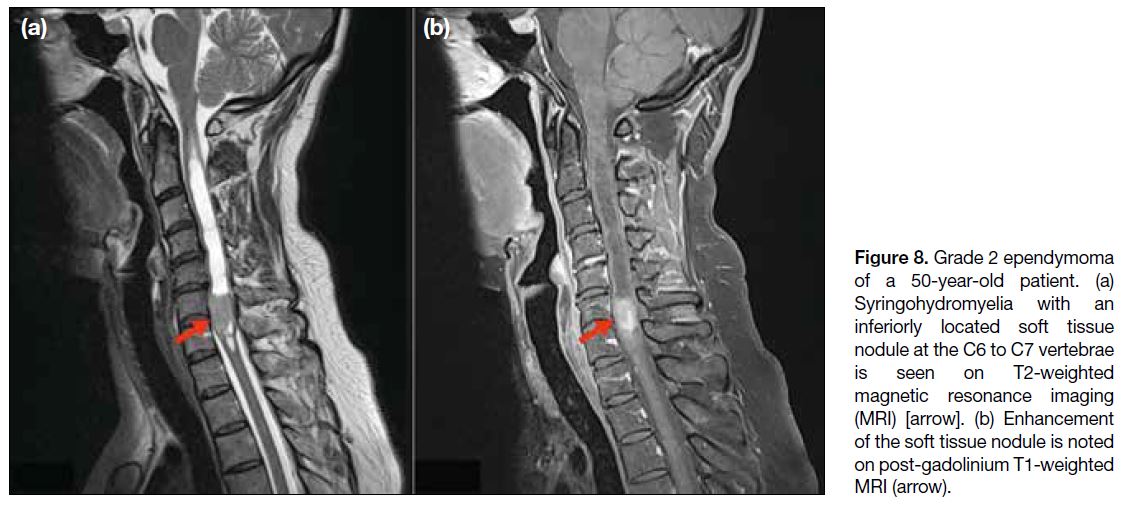
Figure 9. Grade 2 ependymoma
of the same patient in Figure 8.
(a) Enhancing soft tissue nodule at the C6 to C7 vertebrae (arrows) is seen on post-gadolinium T1-weighted magnetic resonance imaging (MRI) [upper row]. (b) Increased 18F-fluoroethyl-L-tyrosine
(18F-FET) tracer uptake of the enhancing soft tissue nodule is noted on FET/MRI (lower row) [arrows]. There is no tracer activity along the wall of the syrinx. Images on the left show axial view while those on the right show sagittal view.
TUMOUR GRADING AND PERIOPERATIVE APPLICATIONS
A study has shown that patients with high-grade gliomas
exhibit significantly higher 18F-FET tracer uptake
than patients with low-grade gliomas.[4] In addition,
the diagnostic performance for grading with 18F-FET
PET/MRI can be improved, given that high-grade
tumours frequently show characteristic dynamic data
with an early time to peak (TTP) within the first 10 to 20 minutes followed by a plateau or a descent of the
time-activity curve.[8] Although a reliable differentiation
of World Health Organization (WHO) grade III/
IV and grade I/II gliomas is not possible because of a
high proportion of active tumours among the latter,
especially in oligodendrogliomas,[1] an early finding
of low invasiveness of the tumour might help the
neurooncologist decide on patient management. The
recommended PET parameters[1] of 18F-FET PET/MRI to
differentiate WHO grade I/II versus grade III/IV glioma
include a TBRmax of 2.5 to 2.7, a TBRmean of 1.9 to 2.0, a TTP <35 minutes, or TAC pattern II (an early peak
followed by a plateau) or III (a decreasing TAC).[1]
In 2021, the WHO classification of central nervous
system tumours has incorporated molecular information
into the diagnosis of brain tumours.[9] The grading
system has been reformed and significantly restructured,
especially for diffuse gliomas. The isocitrate dehydrogenase (IDH) mutation status has important
diagnostic and therapeutic roles. Preoperative reliable
prediction of IDH status can facilitate preliminary
diagnosis of a high-grade tumour and prompt therapeutic
strategies.
A reliable cutoff value for TBRmax or TBRmean in
conventional static 18F-FET PET/MRI to differentiate
IDH status is still under debate. A study with a large
patient population showed a significantly shorter median
TTP in IDH-wildtype gliomas compared with IDH-mutant
gliomas.[10] Therefore, a short TTP in dynamic
18F-FET PET/MRI serves as a good predictor of IDH-wildtype
status, particularly in non–contrast-enhancing
gliomas, with high diagnostic power.[10] Another study
with smaller patient populations suggested combining TTP with TBRmax to achieve higher accuracies in
predicting IDH mutation status.[11] Further studies are
needed to verify the role of 18F-FET PET/MRI in early
detection of IDH status in glioma.
A 38-year-old patient presented with epilepsy. MRI
of the brain showed a left temporal lobe infiltrative
non-enhancing lesion with hyperintense T2-weighted
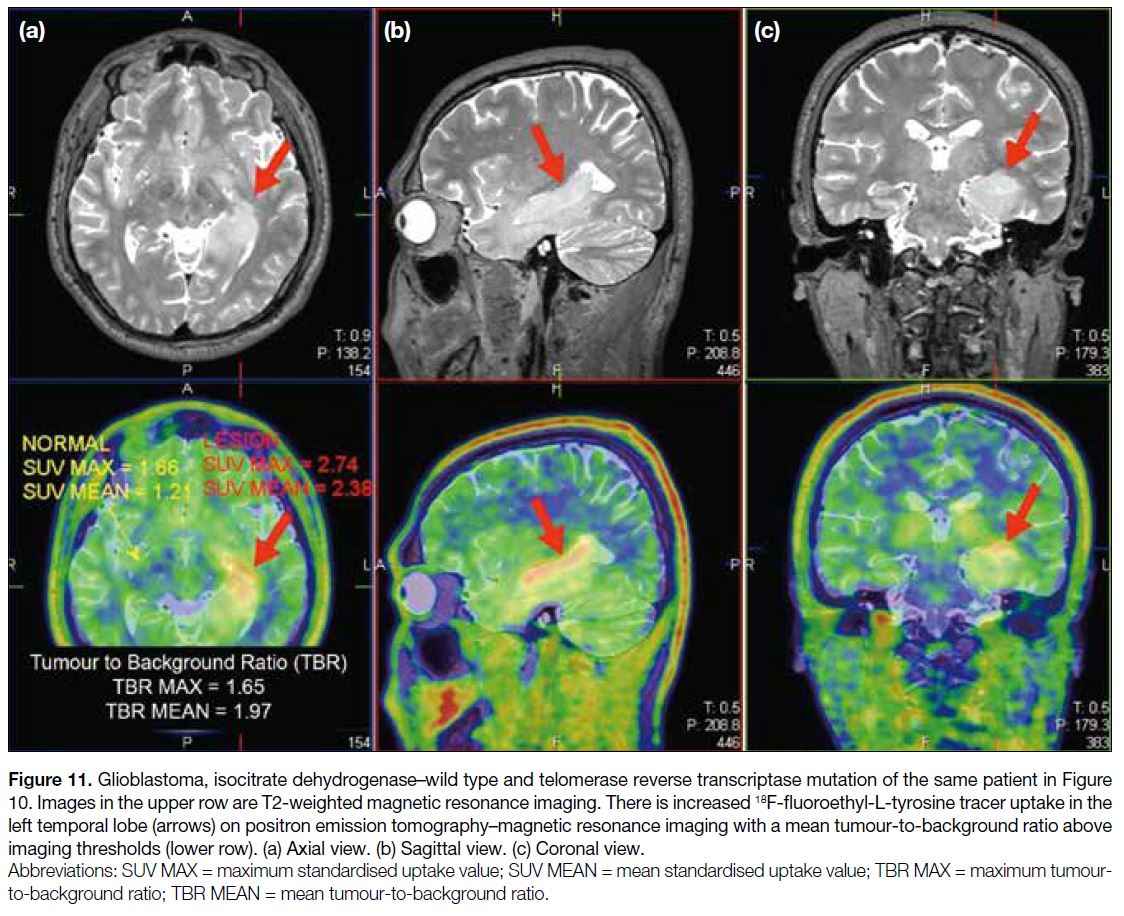
signals (Figure 10). 18F-FET PET/MRI showed a
significant increase in tracer uptake (TBRmean = 1.97)
in the left temporal lobe (Figure 11), suggesting an
active neoplastic process. Despite classical imaging
features of a low-grade glioma in conventional MRI,
a significant increase in tracer activity in 18F-FET PET
suggests a higher-grade lesion, which may alter clinical
management.
Figure 10. Glioblastoma of
a 38-year-old patient. (a) Left temporal lobe infiltrative hyperintense lesion is seen on T2-weighted magnetic resonance imaging (MRI) [arrow]. (b) There is no enhancement on post-gadolinium T1-weighted MRI (arrow).
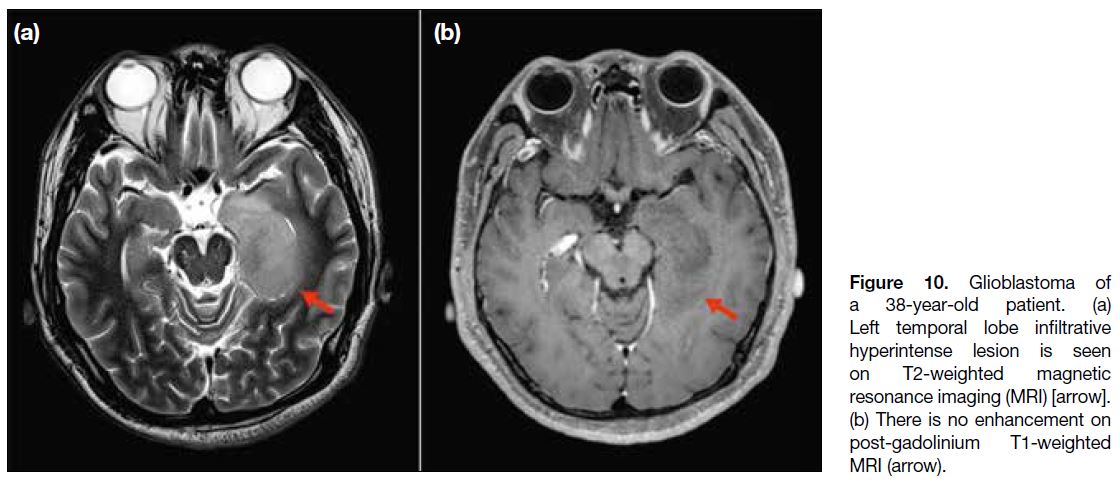
Figure 11. Glioblastoma, isocitrate dehydrogenase–wild type and telomerase reverse transcriptase mutation of the same patient in Figure 10. Images in the upper row are T2-weighted magnetic resonance imaging. There is increased 18F-fluoroethyl-L-tyrosine tracer uptake in the left temporal lobe (arrows) on positron emission tomography–magnetic resonance imaging with a mean tumour-to-background ratio above
imaging thresholds (lower row). (a) Axial view. (b) Sagittal view. (c) Coronal view.
TUMOUR TREATMENT RESPONSE ASSESSMENT AND DIFFERENTIATION FROM TREATMENT-RELATED PSEUDOPROGRESSION
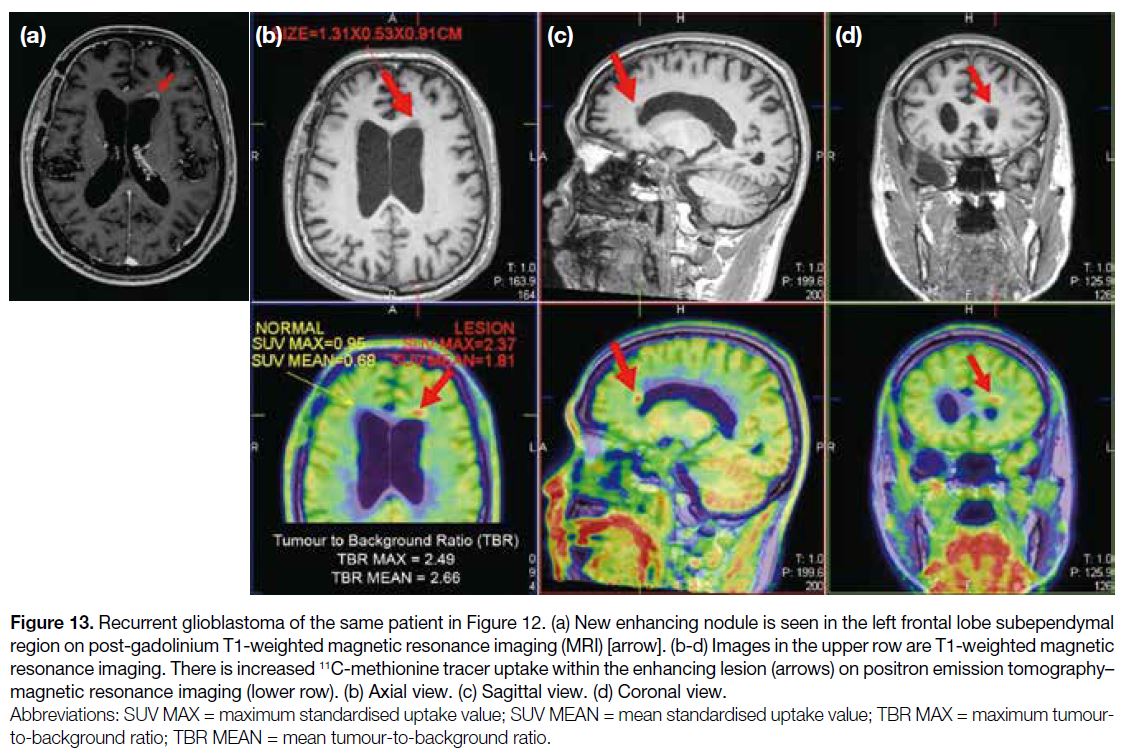
Early detection of high-grade tumour recurrence can be
achieved by performing AA-PET/MRI with follow-up
MRIs, due to the high tumour-to-normal tissue contrast.
A 63-year-old patient had a history of complete removal
of a right temporal lobe glioblastoma (Figure 12). A
follow-up MRI 9 months after surgery showed a new
enhancing focus in the left frontal lobe subependymal
region. 11C-MET PET/MRI showed increased tracer
uptake within the enhancing lesion, with a TBRmean of
2.66 and a TBRmax of 2.49 (Figure 13), suggesting an
active neoplastic process.
Figure 12. (a) Right anterior temporal lobe necrotic glioblastoma of a 63-year-old patient on post-gadolinium T1-weighted magnetic resonance imaging (MRI) before treatment (arrow). (b) Complete tumour removal on postoperative MRI.
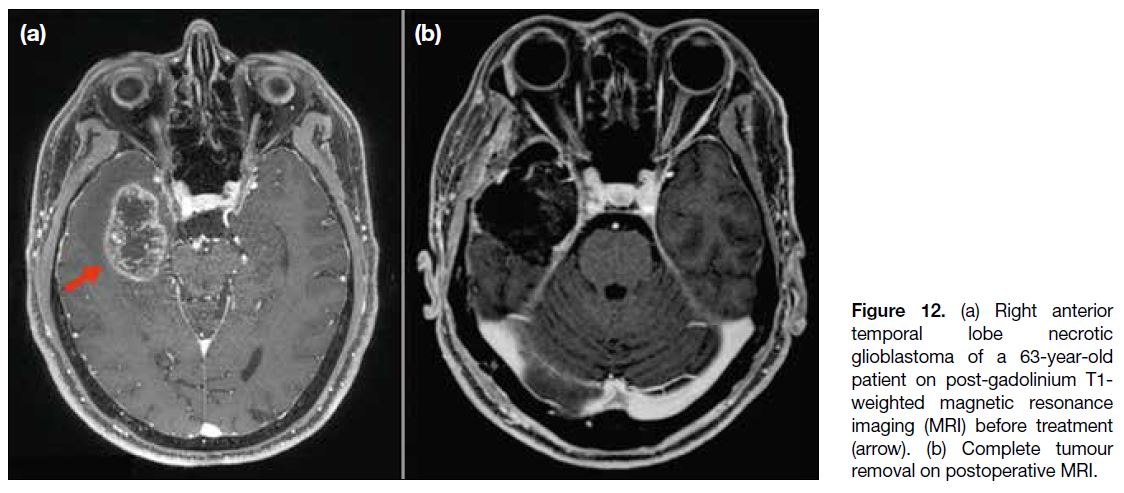
Figure 13. Recurrent glioblastoma of the same patient in Figure 12. (a) New enhancing nodule is seen in the left frontal lobe subependymal
region on post-gadolinium T1-weighted magnetic resonance imaging (MRI) [arrow]. (b-d) Images in the upper row are T1-weighted magnetic
resonance imaging. There is increased 11C-methionine tracer uptake within the enhancing lesion (arrows) on positron emission tomography–magnetic resonance imaging (lower row). (b) Axial view. (c) Sagittal view. (d) Coronal view.
Conventional MRI has poor sensitivity and specificity in
detecting post-therapy recurrence due to its limitations
in differentiating between recurrence and radionecrosis.
As viable tumour cells take up 18F-FET more avidly than
inflammatory cells, AA-PET offers advantages over
conventional MRI, especially in haemorrhagic lesions.
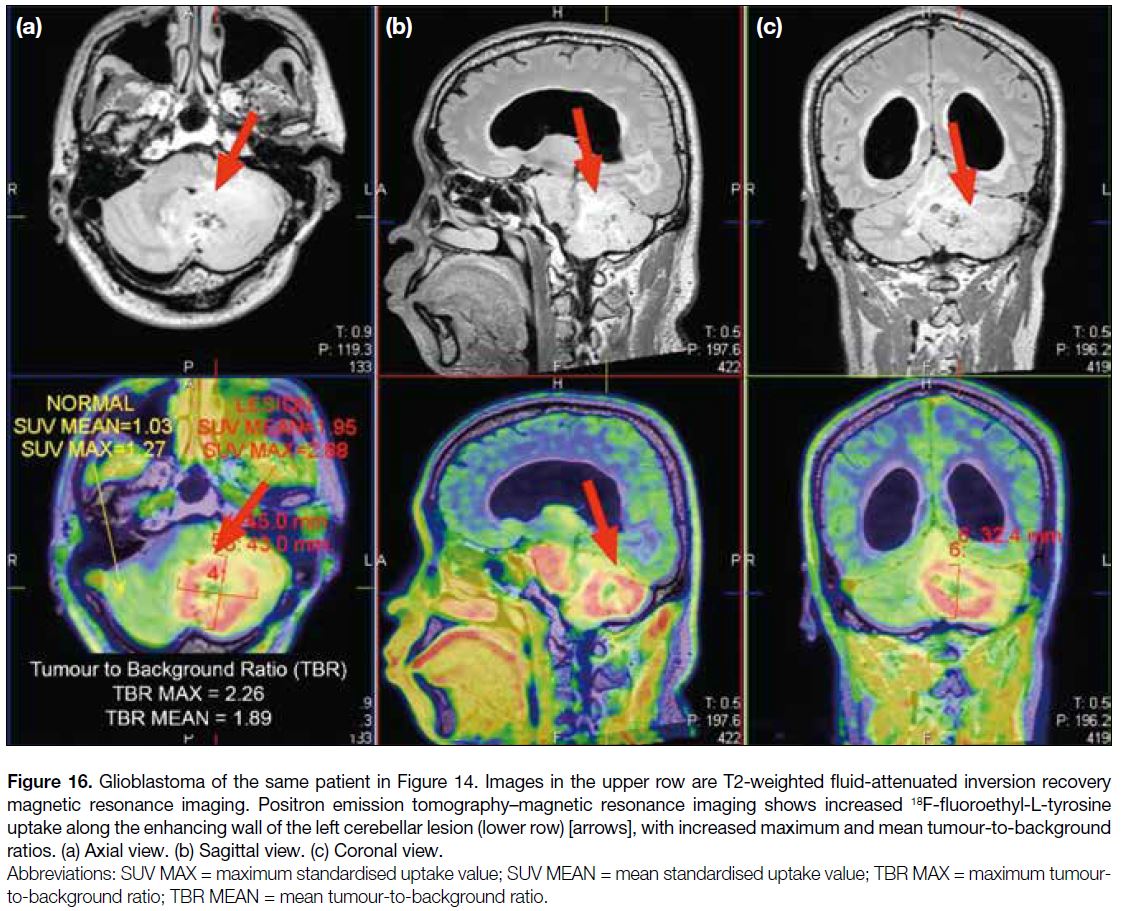
A 53-year-old patient had a left cerebellopontine angle
meningioma resected and irradiated. Follow-up MRI
showed residual meningioma with postoperative changes
(Figure 14). A new rim-enhancing lesion developed in
the left cerebellum with central necrosis and internal
haemorrhage (Figure 15). Advanced MRI techniques
(i.e., MRI perfusion and MRS) did not provide useful
information in the presence of haemorrhage. 18F-FET
PET/MRI showed significantly increased tracer uptake along the enhancing wall of the lesion (TBRmax = 2.26;
TBRmean = 1.89) [Figure 16]. The commonly used
thresholds to differentiate between true progression
and pseudoprogression are a TBRmax of 2.3 for early
pseudoprogression, and a TBRmax or a TBRmean of 1.9 for late pseudoprogression.[1] Therefore, it suggested a high-grade
active neoplastic process.
Figure 14. A 53-year-old patient with a history of left
cerebellopontine angle (CPA) meningioma treated with resection
and radiotherapy. Residual left CPA meningioma with postoperative
and post-irradiation changes (arrowhead) are seen on follow-up
T2-weighted magnetic resonance imaging. There is a new lesion in
the left cerebellum with internal haemorrhage (arrow).
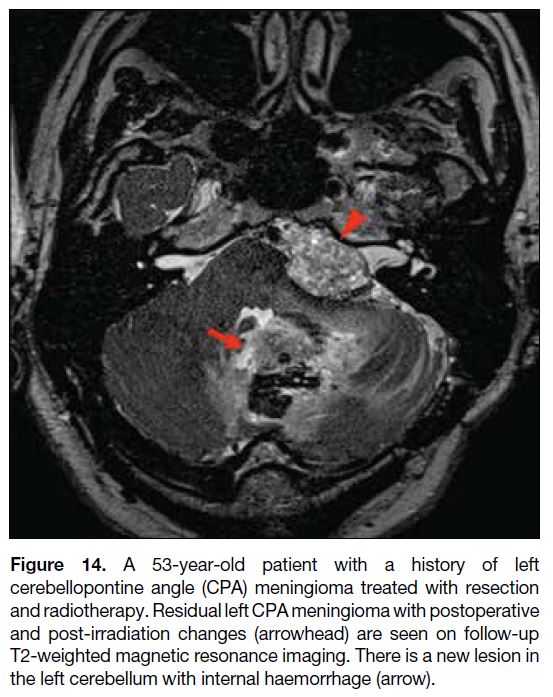
Figure 15. Glioblastoma of the same patient in Figure 14. Post-gadolinium
T1-weighted magnetic resonance imaging shows a
rim-enhancing lesion in the left cerebellum with central necrotic
area (arrow).
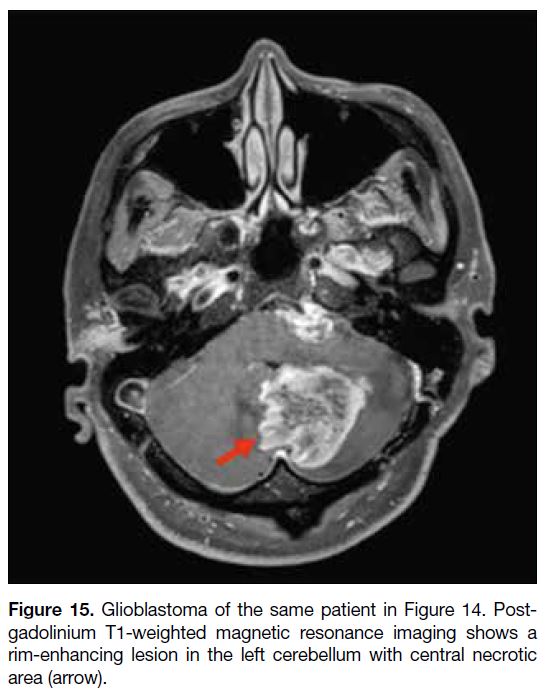
Figure 16. Glioblastoma of the same patient in Figure 14. Images in the upper row are T2-weighted fluid-attenuated inversion recovery
magnetic resonance imaging. Positron emission tomography–magnetic resonance imaging shows increased 18F-fluoroethyl-L-tyrosine
uptake along the enhancing wall of the left cerebellar lesion (lower row) [arrows], with increased maximum and mean tumour-to-background
ratios. (a) Axial view. (b) Sagittal view. (c) Coronal view.
FALSE POSITIVITY OF AMINO ACID POSITRON EMISSION TOMOGRAPHY WITHOUT MAGNETIC RESONANCE IMAGING
Several physiological and pathological causes of
increased amino acid tracer uptake have been reported,
including cortical ischaemia,[12] sarcoidosis,[13] haematoma[14] and abscess.[15] Vascular lesions with amino acid tracer
accumulation due to slow washout may also lead to
misinterpretation.[16] Molecular PET, in combination with
a multiparametric MRI, can provide both structural and
functional information to reduce false positive cases that
might be seen on AA-PET alone.
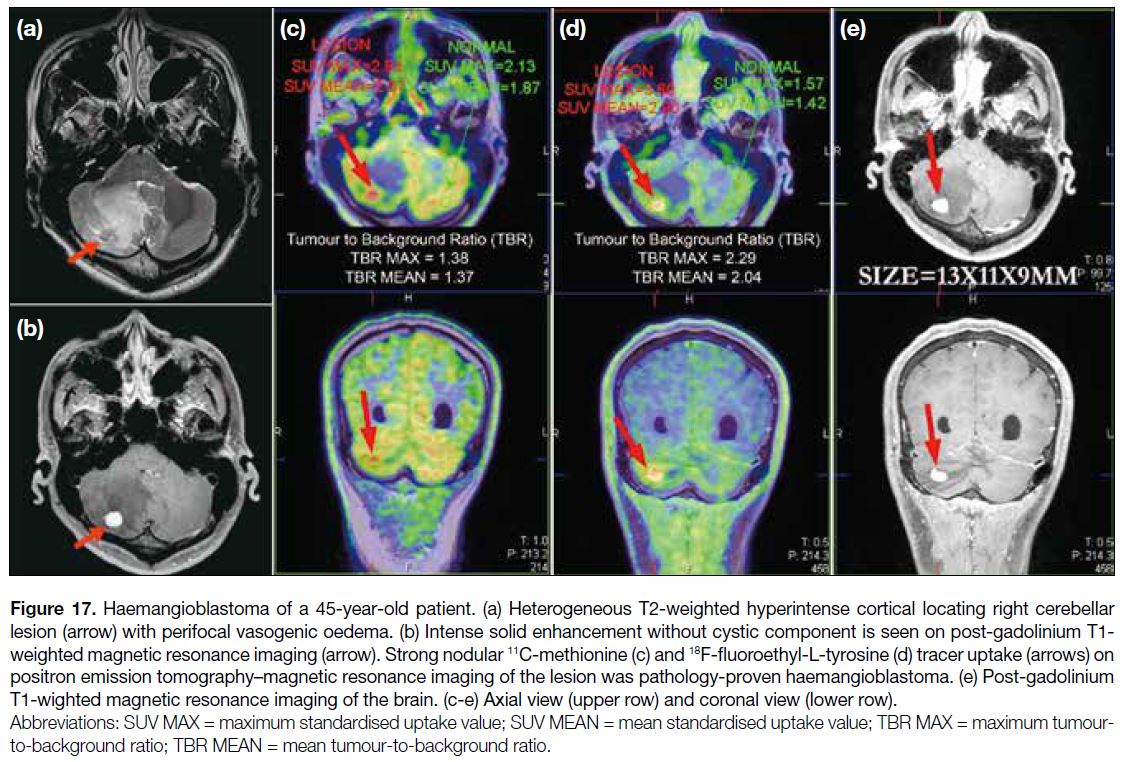
A 45-year-old patient presented with ataxia. MRI of the
brain showed a heterogeneous T2-weighted hyperintense
cortical right cerebellar lesion with perifocal vasogenic
oedema. It showed intense solid enhancement without
cystic component. 11C-MET and 18F-FET PET/MRI
showed strong nodular tracer uptake in the corresponding
right cerebellar lesion (Figure 17). The pathological
diagnosis was haemangioblastoma.
Figure 17. Haemangioblastoma of a 45-year-old patient. (a) Heterogeneous T2-weighted hyperintense cortical locating right cerebellar
lesion (arrow) with perifocal vasogenic oedema. (b) Intense solid enhancement without cystic component is seen on post-gadolinium T1-weighted magnetic resonance imaging (arrow). Strong nodular 11C-methionine (c) and 18F-fluoroethyl-L-tyrosine (d) tracer uptake (arrows) on positron emission tomography–magnetic resonance imaging of the lesion was pathology-proven haemangioblastoma. (e) Post-gadolinium
T1-wighted magnetic resonance imaging of the brain. (c-e) Axial view (upper row) and coronal view (lower row).
CONCLUSION
AA-PET has been developed for decades yet not
routinely implemented in neuro-oncology. Previously,
PET was criticised for its poor spatial resolution. With
technological advancement, the fusion of MRI and
PET images can yield additional insight beyond either
examination alone by differentiating neoplastic from
non-neoplastic processes, preoperatively predicting
the tumour grading according to the recommended
cutoff values, as well as differentiating post-treatment
changes from early tumour recurrence. The location
within the tumour with the highest metabolic activity
can be depicted to aid biopsy and operation. Hybrid
PET/MRI is more patient-friendly and offers practical
advantages; however, careful interpretation and post-processing
of the images by experienced operators are
crucial for the accuracy and reliability of the results. Further studies are needed to evaluate the role of AA-PET,
with the emerging classification of central nervous
system tumours, in predicting IDH status and other
radiogenomic applications in precision cancer medicine.
REFERENCES
1. Law I, Albert NL, Arbizu J, Boellaard R, Drzezga A, Galldiks N,
et al. Joint EANM/EANO/RANO practice guidelines/SNMMI
procedure standards for imaging of gliomas using PET with
radiolabelled amino acids and [18F]FDG: version 1.0. Eur J Nucl
Med Mol Imaging. 2019;46:540-57. Crossref
2. Kracht LW, Miletic H, Busch S, Jacobs AH, Voges J, Hoevels M,
et al. Delineation of brain tumor extent with [11C]L-methionine
positron emission tomography: local comparison with stereotactic
histopathology. Clin Cancer Res. 2004;10:7163-70. Crossref
3. Pauleit D, Floeth F, Hamacher K, Riemenschneider MJ,
Reifenberger G, Müller HW, et al. O-(2-[18F]fluoroethyl)-L-tyrosine
PET combined with MRI improves the diagnostic assessment of
cerebral gliomas. Brain. 2005;128:678-87. Crossref
4. Rapp M, Heinzel A, Galldiks N, Stoffels G, Felsberg J, Ewelt C, et al.
Diagnostic performance of 18F-FET PET in newly diagnosed
cerebral lesions suggestive of glioma. J Nucl Med. 2013;54:229-35. Crossref
5. Herholz K, Hölzer T, Bauer B, Schröder R, Voges J, Ernestus RI, et al. 11C-methionine PET for differential diagnosis of low-grade gliomas. Neurology. 1998;50:1316-22. Crossref
6. Kunz M, Thon N, Eigenbrod S, Hartmann C, Egensperger R,
Herms J, et al. Hot spots in dynamic 18FET-PET delineate malignant tumor parts within suspected WHO grade II gliomas. Neuro Oncol.
2011;13:307-16. Crossref
7. Pirotte BJ, Levivier M, Goldman S, Massager N, Wikler D,
Dewitte O, et al. Positron emission tomography–guided volumetric
resection of supratentorial high-grade gliomas: a survival analysis
in 66 consecutive patients. Neurosurgery. 2009;64:471-81;
discussion 481. Crossref
8. Pöpperl G, Kreth FW, Mehrkens JH, Herms J, Seelos K, Koch W,
et al. FET PET for the evaluation of untreated gliomas: correlation
of FET uptake and uptake kinetics with tumour grading. Eur J Nucl
Med Mol Imaging. 2007;34:1933-42. Crossref
9. WHO Classification of Tumours Editorial Board. WHO
Classification of Tumours, 5th Edition, Volume 6: Central Nervous
System Tumours. World Health Organization: 2021.
10. Vettermann F, Suchorska B, Unterrainer M, Nelwan D, Forbrig R,
Ruf V, et al. Non-invasive prediction of IDH-wildtype genotype in
gliomas using dynamic 18F-FET PET. Eur J Nucl Med Mol Imaging. 2019;46:2581-9.Crossref
11. Verger A, Stoffels G, Bauer EK, Lohmann P, Blau T, Fink GR,
et al. Static and dynamic 18F-FET PET for the characterization of gliomas defined by IDH and 1p/19q status. Eur J Nucl Med Mol
Imaging. 2018;45:443-51. Crossref
12. Rottenburger C, Doostkam S, Prinz M, Meckel S, Nikkhah G,
Meyer PT, et al. Interesting image. Amino acid PET tracer
accumulation in cortical ischemia: an interesting case. Clin Nucl
Med. 2010;35:907-8. Crossref
13. Pichler R, Wurm G, Nussbaumer K, Kalev O, Silye R, Weis S.
Sarcoidois and radiation-induced astrogliosis causes pitfalls in
neuro-oncologic positron emission tomography imaging by O-(2-
[18F]fluoroethyl)-L-tyrosine. J Clin Oncol. 2010;28:e753-5. Crossref
14. Salber D, Stoffels G, Oros-Peusquens AM, Shah NJ, Reifenberger G,
Hamacher K, et al. Comparison of O-(2-18F-fluoroethyl)-L-tyrosine and L-3H-methionine uptake in cerebral hematomas. J Nucl Med. 2010;51:790-7. Crossref
15. Salber D, Stoffels G, Pauleit D, Oros-Peusquens AM, Shah NJ,
Klauth P, et al. Differential uptake of O-(2-18F-fluoroethyl)-Ltyrosine, L-3H-methionine, and 3H-deoxyglucose in brain abscesses. J Nucl Med. 2007;48:2056-62. Crossref
16. Stockhammer F, Prall F, Dunkelmann S, Plotkin M, Piek J. Stereotactic biopsy of a cerebral capillary telangiectasia after a misleading F-18-FET-PET. J Neurol Surg A Cent Eur Neurosurg. 2012;73:407-9. Crossref